
- LIVE QUOTES
- LEARN
- HELP
 Nasdaq
 Wall Street Journal
EN
Is It Time To Reassess IAC (IAC) After A 76% Five Year Share Price Slide
- If you are wondering whether IAC is a bargain or a value trap at around US$34.31, starting with a clear look at what you are paying for today can help ground your view.
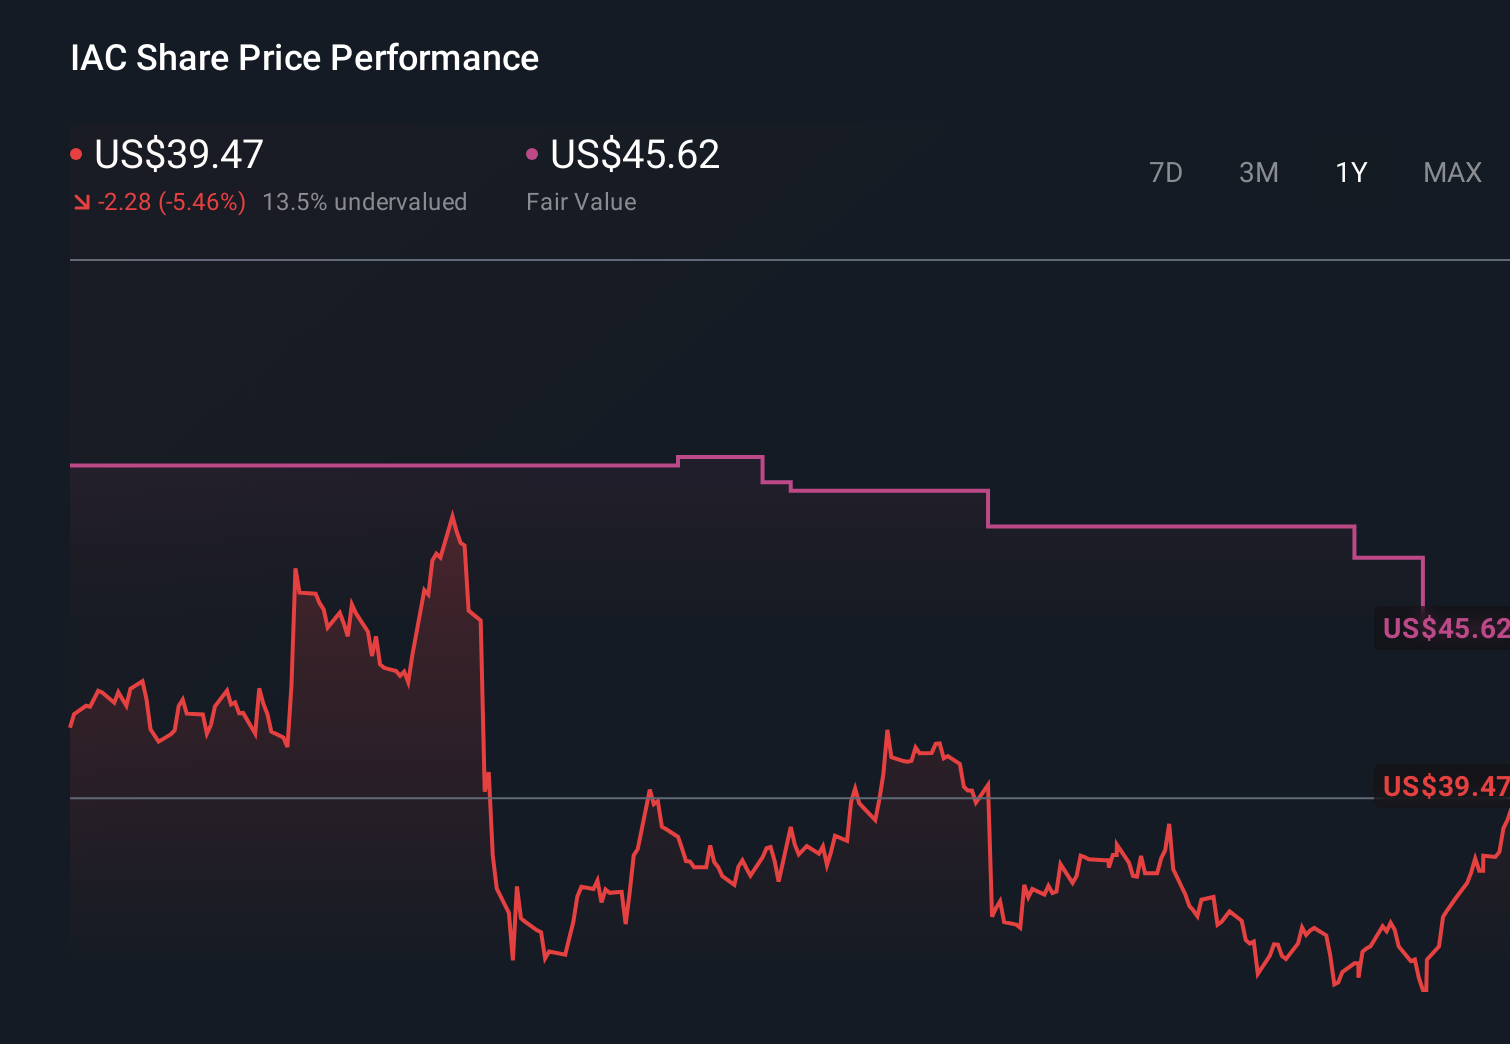
- The stock has been under pressure recently, with returns of a 3.8% decline over the past 7 days, a 13.4% decline over 30 days, a 12.1% decline year to date and an 11.4% decline over the past year, alongside a 20.6% decline over 3 years and a 76.1% decline over 5 years.
- These moves are playing out against a backdrop of ongoing coverage of IAC as a media and internet holding company. Investors are weighing the value of its portfolio and capital allocation decisions, and recent commentary has focused on how the market is pricing its collection of businesses and assets rather than reacting to a single event.
- On Simply Wall St's 6 point valuation framework, IAC currently scores 3 out of 6. This suggests some checks point to undervaluation while others are more mixed. Next we will break down the standard valuation approaches before finishing with a way to interpret value that goes beyond the usual ratios.
Find out why IAC's -11.4% return over the last year is lagging behind its peers.
Approach 1: IAC Discounted Cash Flow (DCF) Analysis
A Discounted Cash Flow model takes forecasts of a company’s future cash flows and discounts them back to today, aiming to estimate what the entire stream is worth in present dollar terms.
For IAC, the model used is a 2 Stage Free Cash Flow to Equity approach, based on cash flows in $. The latest twelve month free cash flow is about $10.07 million. Analysts have provided explicit forecasts out to 2030, with projected free cash flow of $177.4 million in that year. Beyond the first few years, Simply Wall St extends the cash flow path using its own extrapolation, which is reflected in the ten year projection set.
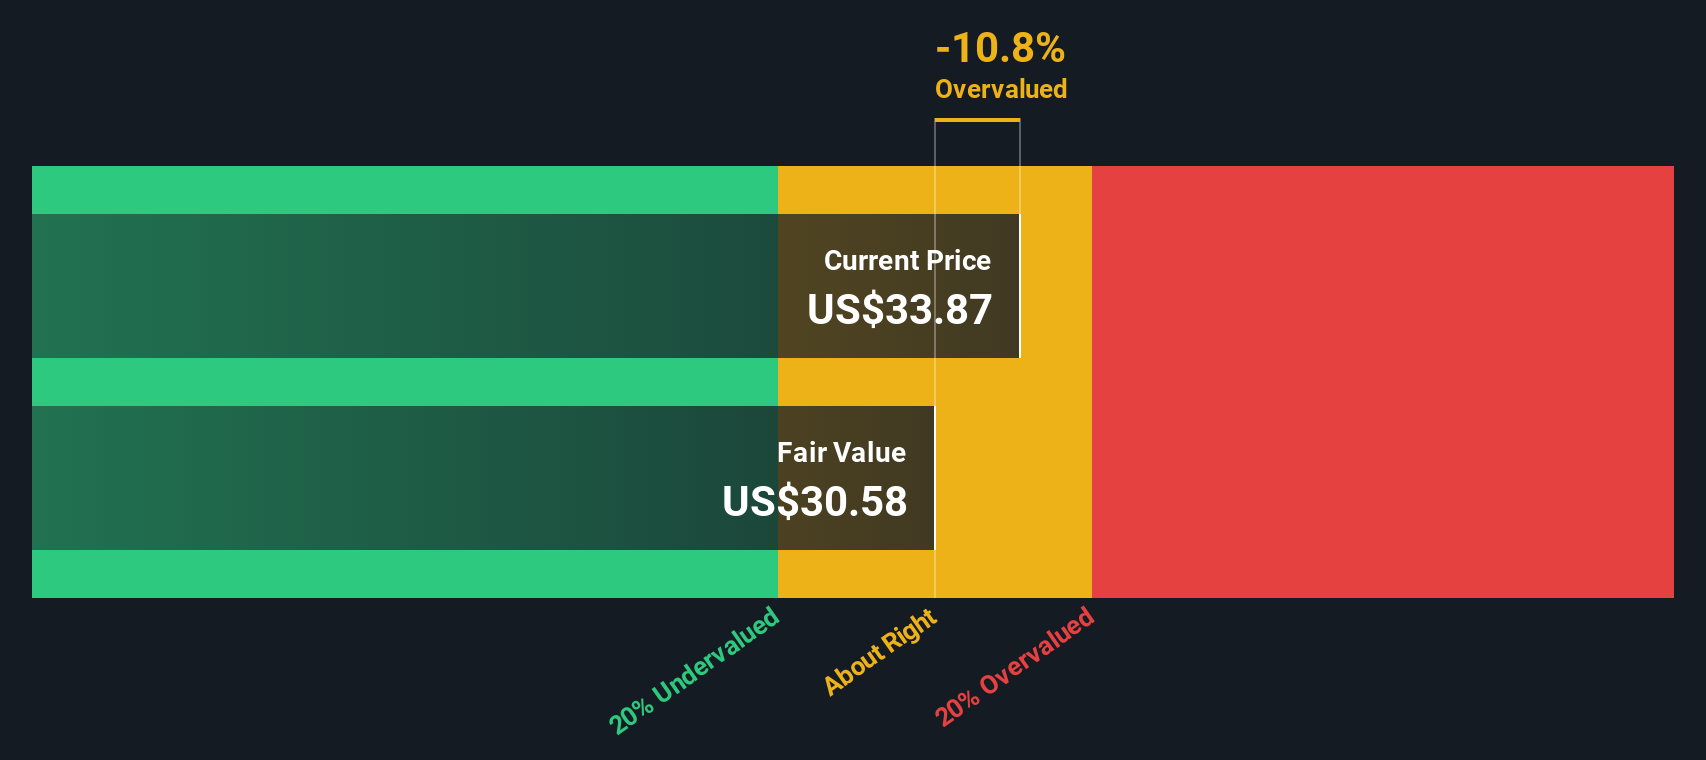
When these projected cash flows are discounted back, the model arrives at an estimated intrinsic value of about $29.94 per share. Compared with the recent share price of around $34.31, the DCF indicates IAC is about 14.6% overvalued on this set of assumptions.
Result: OVERVALUED
Our Discounted Cash Flow (DCF) analysis suggests IAC may be overvalued by 14.6%. Discover 53 high quality undervalued stocks or create your own screener to find better value opportunities.
Approach 2: IAC Price vs Sales
For companies where earnings can be uneven, using the Price to Sales, or P/S, ratio can be a practical way to compare what you are paying for each dollar of revenue. Investors generally accept paying a higher P/S if they expect stronger growth or see lower risk, while slower growth or higher risk usually means a lower “normal” multiple is more appropriate.
IAC currently trades on a P/S ratio of 1.12x. That sits above the Interactive Media and Services industry average of 0.88x, but below the peer group average of 2.05x. To refine that comparison, Simply Wall St uses a proprietary “Fair Ratio” that estimates the P/S multiple that might fit IAC given factors like its earnings growth profile, profit margins, industry, market cap and risk characteristics.
Because the Fair Ratio for IAC is 1.16x, versus the current 1.12x, the stock screens as slightly below that modelled level, suggesting it is broadly aligned with what the framework implies, with a small lean toward undervaluation on this measure.
Result: ABOUT RIGHT

P/S ratios tell one story, but what if the real opportunity lies elsewhere? Start investing in legacies, not executives. Discover our 23 top founder-led companies.
Upgrade Your Decision Making: Choose Your IAC Narrative
Earlier we mentioned that there is an even better way to think about valuation. On Simply Wall St this shows up as Narratives, which are simple stories you create around IAC that link your view of its business, your assumptions for future revenue, earnings and margins, and the fair value you arrive at, all within the Community page used by millions of investors.
Each Narrative ties the story you believe to a set of forecast numbers and then to a fair value. Because it is built into the platform, it automatically refreshes when new information such as news, earnings or updated analyst forecasts is added.
You can then compare the Fair Value from your Narrative to the current share price to help decide whether IAC looks closer to a buy, a hold or a sell for you, without needing to build a spreadsheet or complex model yourself.
For example, one IAC Narrative on the platform assumes a Fair Value of about US$38.00 with revenue declining 1.85% a year, a 1.41% profit margin and a future P/E near 98x. A more optimistic Narrative works off a Fair Value of US$60.00, revenue declining 12.73% a year, a 9.67% profit margin and a future P/E of about 21x. This shows how two investors can look at the same company and reach very different but clearly framed conclusions.
Do you think there's more to the story for IAC? Head over to our Community to see what others are saying!
This article by Simply Wall St is general in nature. We provide commentary based on historical data and analyst forecasts only using an unbiased methodology and our articles are not intended to be financial advice. It does not constitute a recommendation to buy or sell any stock, and does not take account of your objectives, or your financial situation. We aim to bring you long-term focused analysis driven by fundamental data. Note that our analysis may not factor in the latest price-sensitive company announcements or qualitative material. Simply Wall St has no position in any stocks mentioned.
Have feedback on this article? Concerned about the content? Get in touch with us directly. Alternatively, email editorial-team@simplywallst.com