
- LIVE QUOTES
- LEARN
- HELP
 Nasdaq
 Wall Street Journal
EN
Is It Time To Reassess Badger Meter (BMI) After A 28% One-Year Share Price Slide
- If you are wondering whether Badger Meter is attractively priced at its current level, this breakdown will help you see how its market value lines up with its fundamentals.
- The stock most recently closed at US$154.88, after a 2.4% gain over the last 7 days. However, it shows a 9.4% decline over 30 days, a 12.2% decline year to date, and a 28.2% decline over the past year, set against longer term returns of 31.5% over 3 years and 51.6% over 5 years.
- Recent coverage of Badger Meter has focused on its role in water metering and related technologies, as investors consider how that positioning fits into their long term themes. This backdrop provides useful context for understanding why the share price has shifted over different time frames.
- Right now, Badger Meter scores 1 out of 6 on our valuation checks, as shown in this valuation summary. Next, we will walk through the key valuation methods behind that score before finishing with a more rounded way to think about what the stock might be worth.
Badger Meter scores just 1/6 on our valuation checks. See what other red flags we found in the full valuation breakdown.
Approach 1: Badger Meter Discounted Cash Flow (DCF) Analysis
A Discounted Cash Flow, or DCF, model takes estimates of a company’s future cash flows, then discounts them back to today’s dollars to arrive at an estimate of what the business may be worth now.
For Badger Meter, the model used is a 2 Stage Free Cash Flow to Equity approach, based on last twelve months free cash flow of about $169.1 million. Analyst projections extend part of the way, and Simply Wall St then extrapolates further cash flows. Within this framework, Badger Meter’s free cash flow is projected to be $294.9 million in 2035, with interim estimates such as $218.5 million in 2029.
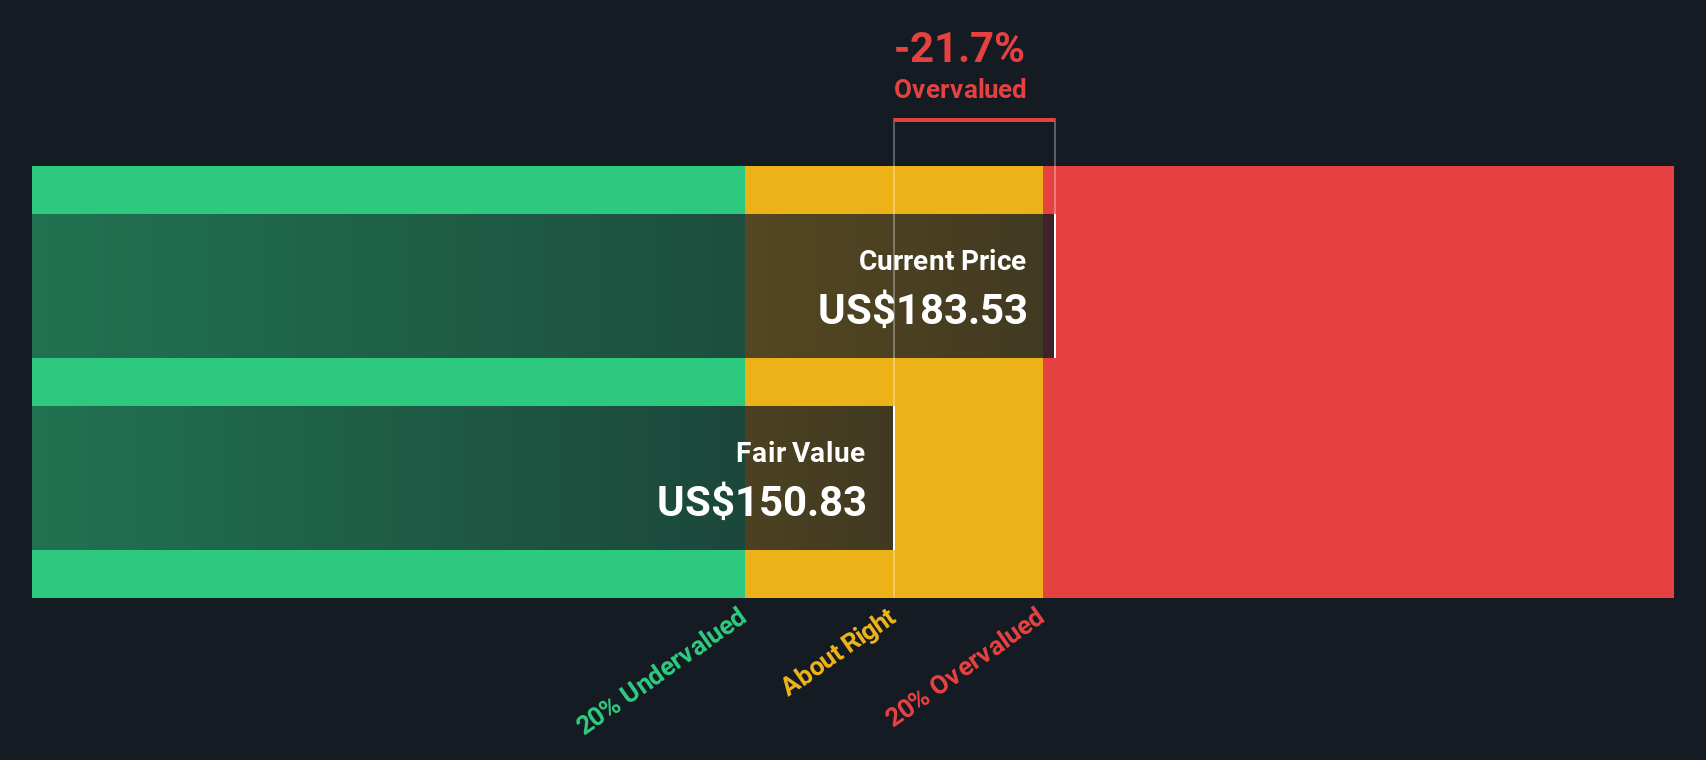
Aggregating and discounting these yearly cash flows results in an estimated intrinsic value of about $144.87 per share. Compared with the recent share price of $154.88, the DCF output suggests the stock is roughly 6.9% above this estimate, so the model indicates that Badger Meter is trading close to the level supported by these cash flow assumptions.
Result: ABOUT RIGHT
Badger Meter is fairly valued according to our Discounted Cash Flow (DCF), but this can change at a moment's notice. Track the value in your watchlist or portfolio and be alerted on when to act.
Approach 2: Badger Meter Price vs Earnings
For profitable companies like Badger Meter, the P/E ratio is a useful way to see how much you are paying for each dollar of current earnings. It lets you line up the share price against the business’s earnings power in a single, simple number.
What counts as a “normal” P/E depends a lot on how the market views a company’s growth prospects and risks. Higher expected growth or lower perceived risk can justify a higher multiple, while slower expected growth or higher risk usually lines up with a lower P/E.
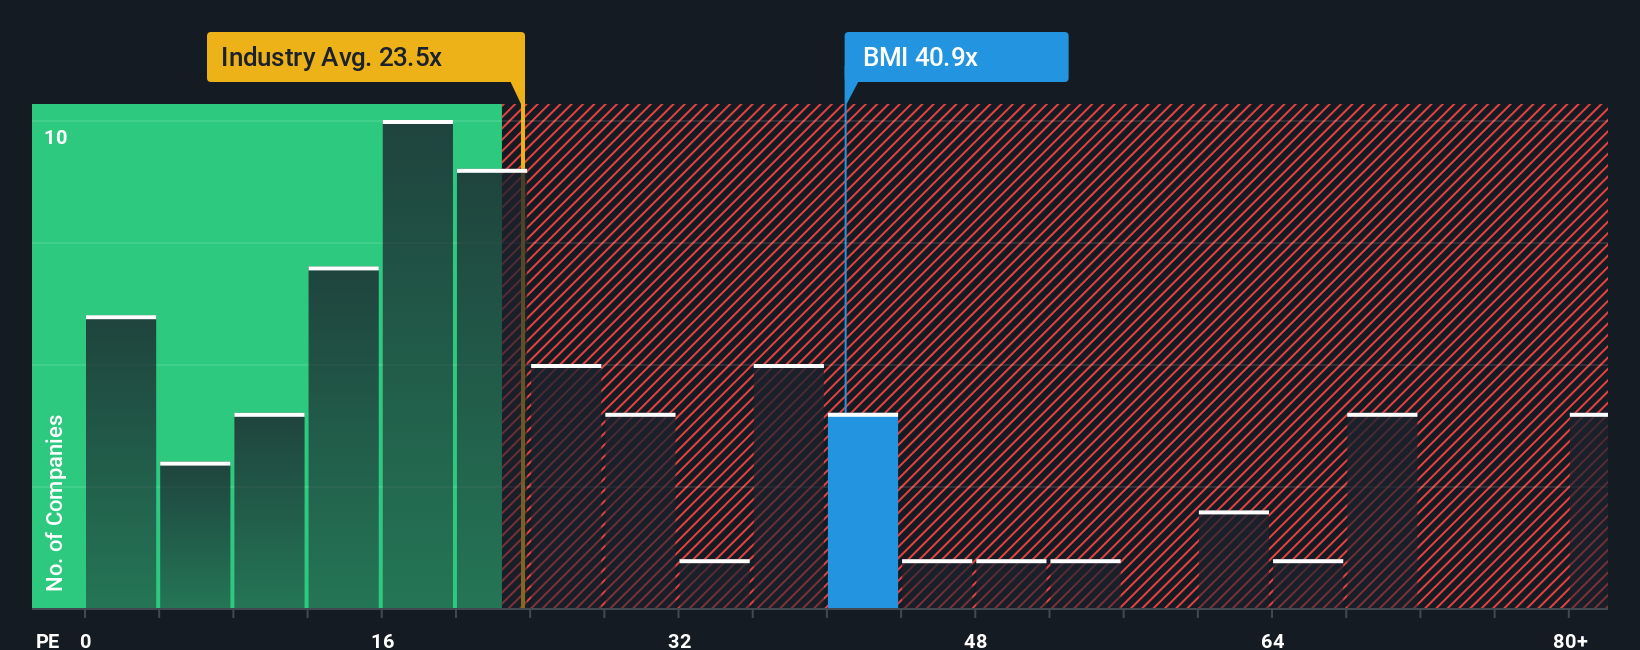
Badger Meter currently trades on a P/E of 32.23x. That sits above the Electronic industry average of 28.31x, yet below the peer group average of 41.12x. Simply Wall St’s Fair Ratio for Badger Meter is 23.43x. This is its proprietary view of an appropriate P/E given factors such as earnings growth, industry, profit margins, market cap and risk profile.
The Fair Ratio aims to be more tailored than a simple comparison with peers or the broader industry because it adjusts for those business specific drivers rather than relying on broad group averages. Set against the current P/E of 32.23x, the Fair Ratio of 23.43x indicates the shares trade at a higher multiple than this model would suggest.
Result: OVERVALUED
P/E ratios tell one story, but what if the real opportunity lies elsewhere? Start investing in legacies, not executives. Discover our 23 top founder-led companies.
Upgrade Your Decision Making: Choose your Badger Meter Narrative
Earlier we mentioned that there is an even better way to understand valuation. Let us introduce you to Narratives, a simple tool on Simply Wall St’s Community page. With Narratives, you can connect your view of Badger Meter’s story to specific forecasts for revenue, earnings and margins. You can then compare the Fair Value from that story with the current price to frame your buy or sell decisions, and see that view update automatically when new news or earnings arrive. For example, one investor might build a bullish Badger Meter Narrative around a Fair Value of US$264.0 that leans on faster growth and a higher future P/E. Another investor might build a more cautious Narrative around US$172.0 that leans on slower growth and a lower multiple. Both can clearly see how their assumptions translate into different estimates of what the shares might be worth.
Do you think there's more to the story for Badger Meter? Head over to our Community to see what others are saying!

This article by Simply Wall St is general in nature. We provide commentary based on historical data and analyst forecasts only using an unbiased methodology and our articles are not intended to be financial advice. It does not constitute a recommendation to buy or sell any stock, and does not take account of your objectives, or your financial situation. We aim to bring you long-term focused analysis driven by fundamental data. Note that our analysis may not factor in the latest price-sensitive company announcements or qualitative material. Simply Wall St has no position in any stocks mentioned.
Have feedback on this article? Concerned about the content? Get in touch with us directly. Alternatively, email editorial-team@simplywallst.com