
- LIVE QUOTES
- LEARN
- HELP
 Nasdaq
 Wall Street Journal
EN
Is Hamilton Lane (HLNE) Attractive After Recent Share Price Weakness And Mixed Valuation Signals
- If you are wondering whether Hamilton Lane is attractively priced right now, you are not alone. This article is built to help you size up the stock through a clear valuation lens.
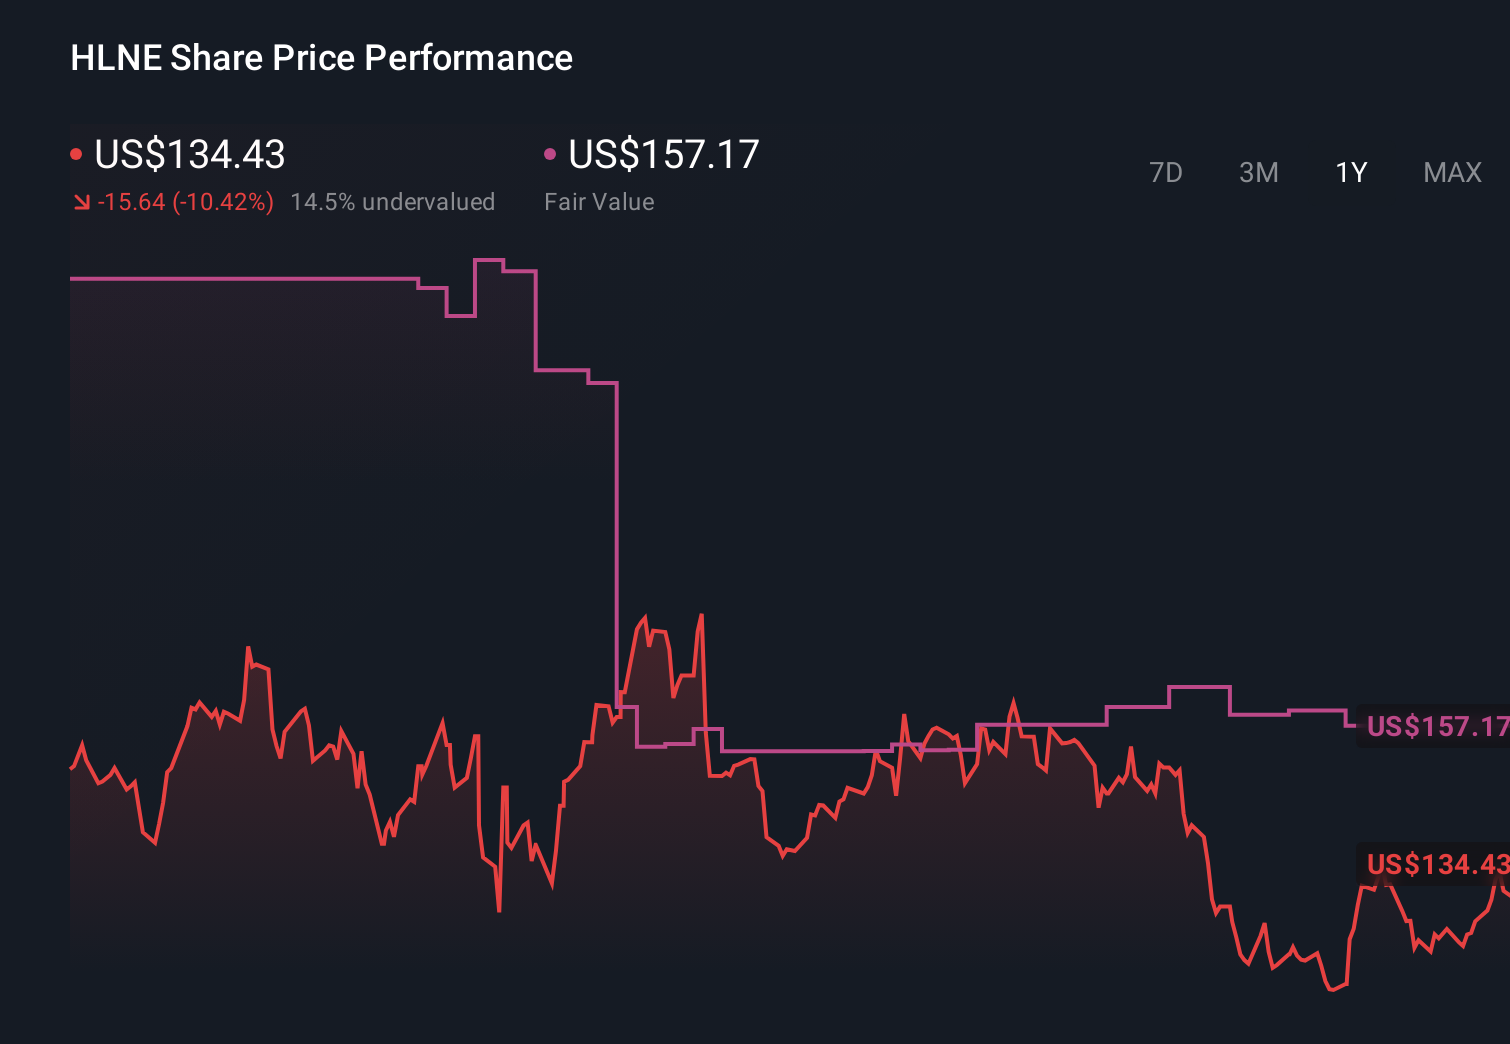
- The share price closed at US$122.76, with returns of a 6.8% decline over 7 days, 17.2% decline over 30 days, 10.2% decline year to date, 20.2% decline over 1 year and 59.5% and 42.2% over 3 and 5 years respectively. This gives a mixed picture of recent and longer term performance.
- Recent price moves sit against a backdrop of ongoing interest in listed alternative asset managers and how public market valuations compare to the broader asset management peer group. Evergreen coverage like this is aimed at helping investors interpret those moves through consistent valuation checks rather than short term headlines.
- Hamilton Lane currently scores 3 out of 6 on our valuation checks, and you can see the detailed breakdown in our valuation score. Next we will walk through the standard valuation approaches behind that score and finish with a more holistic way to think about what the stock might be worth.
Find out why Hamilton Lane's -20.2% return over the last year is lagging behind its peers.
Approach 1: Hamilton Lane Excess Returns Analysis
The Excess Returns model asks a simple question: after covering the required return for shareholders, how much extra value does Hamilton Lane generate on its equity base, and what is that stream of excess worth per share today?
For Hamilton Lane, the model uses a Book Value of US$19.96 per share and a Stable EPS of US$9.27 per share, based on the median return on equity from the past 5 years. The cost of equity is estimated at US$2.18 per share, which leaves an Excess Return of US$7.09 per share. This indicates that the company is expected to earn more on its equity than the required shareholder return, with an average return on equity of 33.64% feeding into this estimate.
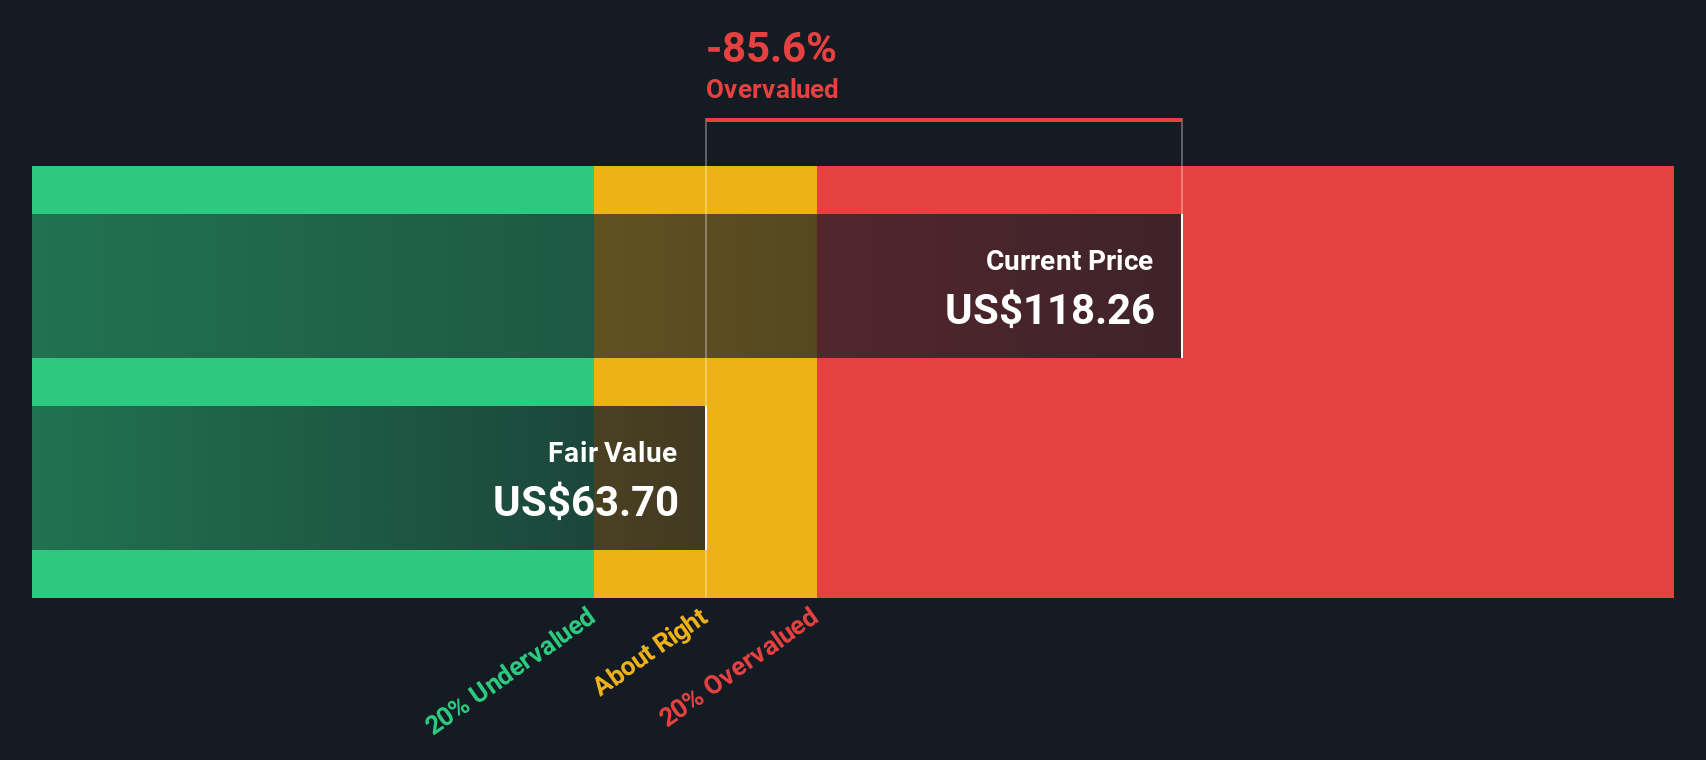
Looking ahead, the Stable Book Value is set at US$27.56 per share, sourced from weighted future book value estimates from 2 analysts. When those expected excess returns are projected and discounted, the model arrives at an intrinsic value of about US$184.73 per share. Compared with the recent share price of US$122.76, this framework suggests the stock is about 33.5% undervalued.
Result: UNDERVALUED
Our Excess Returns analysis suggests Hamilton Lane is undervalued by 33.5%. Track this in your watchlist or portfolio, or discover 53 more high quality undervalued stocks.
Approach 2: Hamilton Lane Price vs Earnings
For a profitable company like Hamilton Lane, the P/E ratio is a useful shorthand for what the market is currently willing to pay for each dollar of earnings. It gives you a quick read on how “expensive” those earnings are today.
What counts as a normal or fair P/E depends on how the market views a company’s growth prospects and risk. Higher expected growth or lower perceived risk can justify a higher P/E, while slower growth or higher risk usually points to a lower multiple.
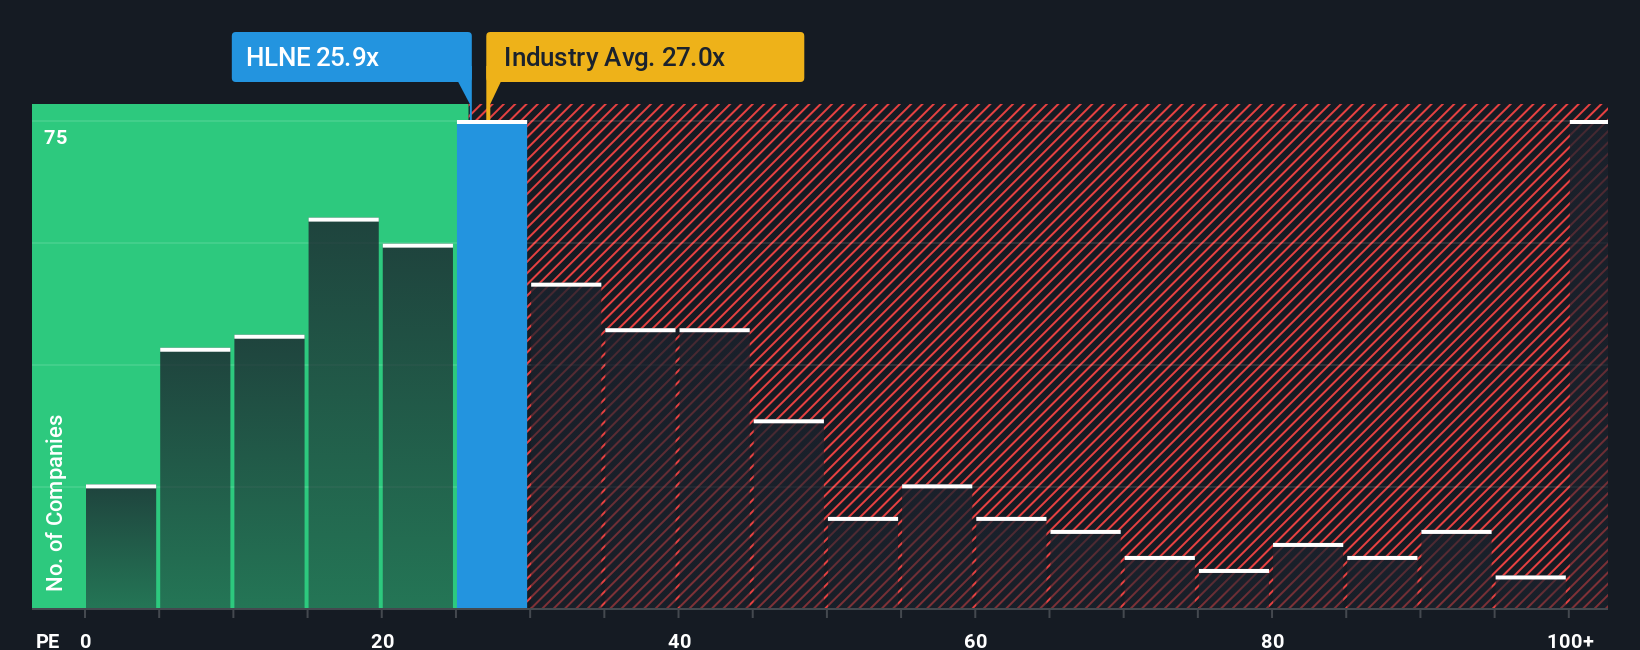
Hamilton Lane currently trades on a P/E of 23.10x. That sits close to the Capital Markets industry average of 23.12x, and above the broader peer group average of 12.64x. Simply Wall St’s Fair Ratio for Hamilton Lane is 19.23x, which is a proprietary estimate of what the P/E might be given factors like earnings growth, profit margins, industry, market value and risk profile.
The Fair Ratio can be more informative than a simple peer or industry comparison because it adjusts for Hamilton Lane’s specific characteristics rather than assuming all companies in the group deserve the same multiple. With the current P/E of 23.10x sitting above the Fair Ratio of 19.23x, this framework points to the shares looking overvalued on a P/E basis.
Result: OVERVALUED
P/E ratios tell one story, but what if the real opportunity lies elsewhere? Start investing in legacies, not executives. Discover our 23 top founder-led companies.
Upgrade Your Decision Making: Choose your Hamilton Lane Narrative
Earlier we mentioned that there is an even better way to think about valuation. This is where Narratives come in, giving you a simple story behind the numbers by linking your view of Hamilton Lane, your estimates for future revenue, earnings and margins, and your own Fair Value to the current share price. This helps you see whether you think it is attractively or expensively priced, all within a Community feature on Simply Wall St that is used by millions of investors. Narratives are refreshed when new information like news or earnings arrives. For example, one Hamilton Lane Narrative might lean closer to the more bullish Fair Value of about US$181.14, with assumptions such as revenue growth of 17.48%, a profit margin of 40.08% and a future P/E of 23.40x. Another could sit nearer the more cautious Fair Value of US$159.00, using revenue growth of 16.07%, a profit margin of 41.76% and a future P/E of 20.53x. Both can be compared side by side with the latest market price to help you decide what makes sense for you.
Do you think there's more to the story for Hamilton Lane? Head over to our Community to see what others are saying!
This article by Simply Wall St is general in nature. We provide commentary based on historical data and analyst forecasts only using an unbiased methodology and our articles are not intended to be financial advice. It does not constitute a recommendation to buy or sell any stock, and does not take account of your objectives, or your financial situation. We aim to bring you long-term focused analysis driven by fundamental data. Note that our analysis may not factor in the latest price-sensitive company announcements or qualitative material. Simply Wall St has no position in any stocks mentioned.
Have feedback on this article? Concerned about the content? Get in touch with us directly. Alternatively, email editorial-team@simplywallst.com