
- LIVE QUOTES
- LEARN
- HELP
 Nasdaq
 Wall Street Journal
EN
Is Bruker (BRKR) Starting To Look Interesting After A Steep Share Price Slide?
- If you are wondering whether Bruker is starting to look like value after a rough stretch, this article will walk through what the current share price may or may not be offering you.
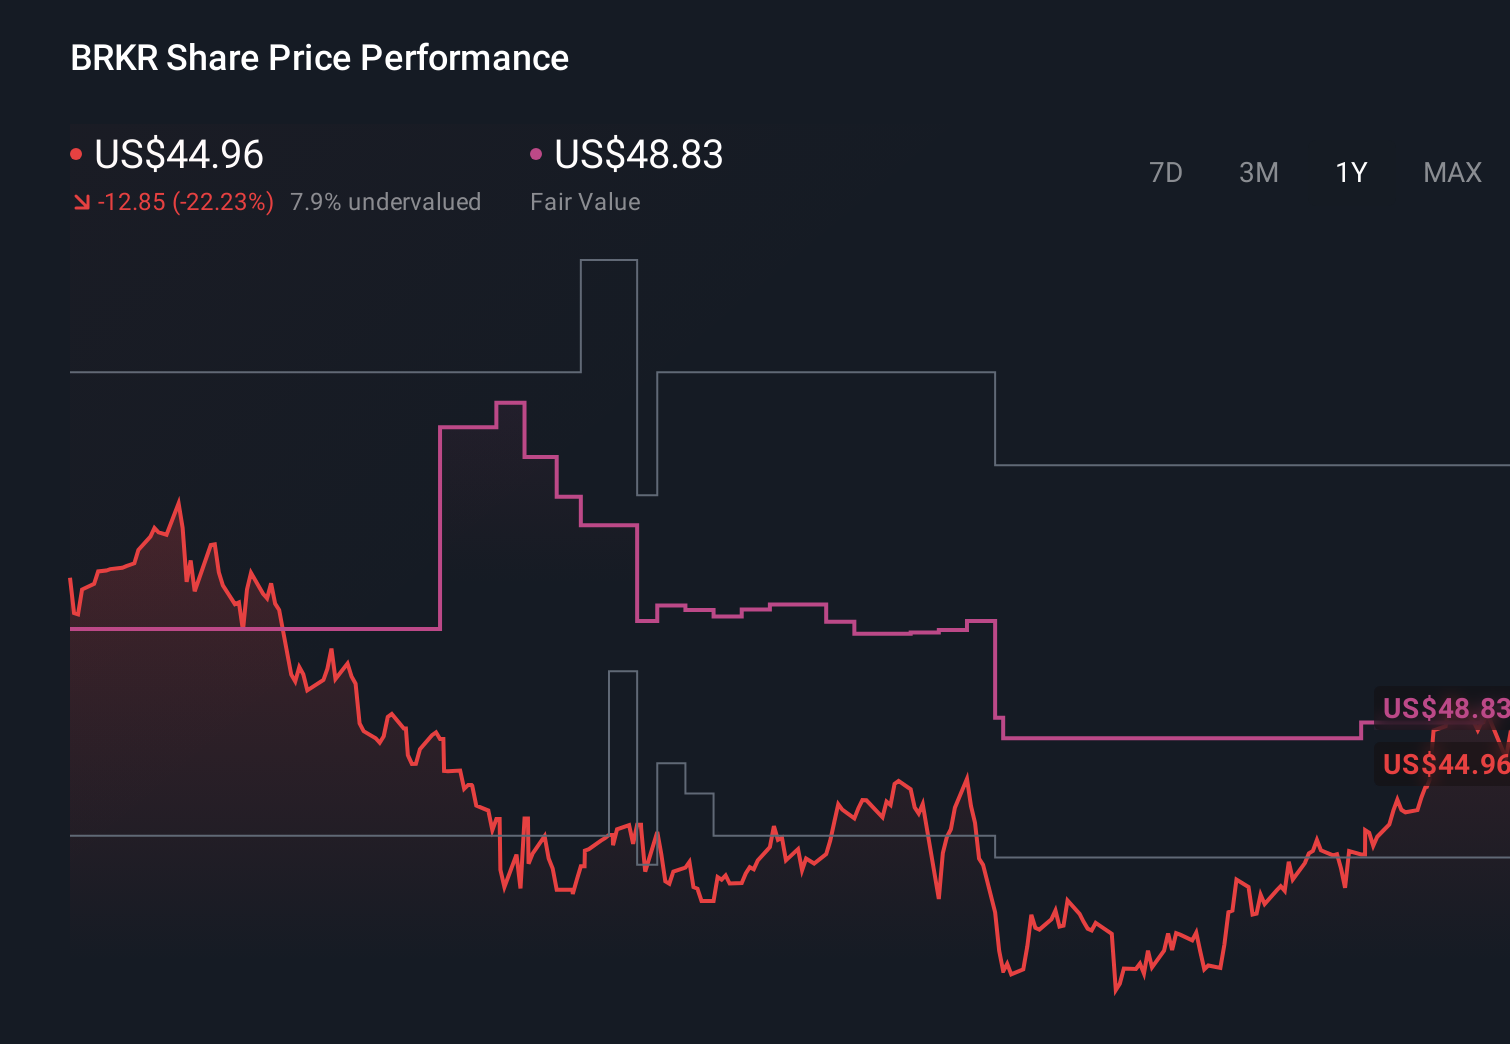
- The stock last closed at US$36.51, with returns of 12.9% decline over 7 days, 25.7% decline over 30 days, 24.1% decline year to date, 26.7% decline over 1 year, 49.9% decline over 3 years and 41.0% decline over 5 years.
- These moves sit against a backdrop of ongoing interest in Bruker as a life sciences tools and diagnostics company. Sentiment can swing as investors reassess long term demand for its technologies and spending trends in research and healthcare. While this article is not tied to a specific news announcement, it is intended to give you a steady reference point on valuation that stays useful beyond any single headline.
- On Simply Wall St's valuation checks, Bruker currently scores 5 out of 6. Next we will walk through what that means across different valuation approaches and hint at an even richer way to think about value that we will come back to at the end of the article.
Find out why Bruker's -26.7% return over the last year is lagging behind its peers.
Approach 1: Bruker Discounted Cash Flow (DCF) Analysis
A Discounted Cash Flow, or DCF, model takes estimates of a company’s future cash flows, then discounts them back into today’s dollars to get an implied value per share.
For Bruker, Simply Wall St uses a 2 Stage Free Cash Flow to Equity model. The latest twelve month free cash flow is a loss of $23.36 million, so the model leans heavily on forward expectations rather than recent cash generation. Analyst estimates and extrapolations have Bruker’s free cash flow reaching $391 million in 2029, with a series of projected figures between $273.50 million in 2026 and $564.23 million in 2035, all in US dollars.
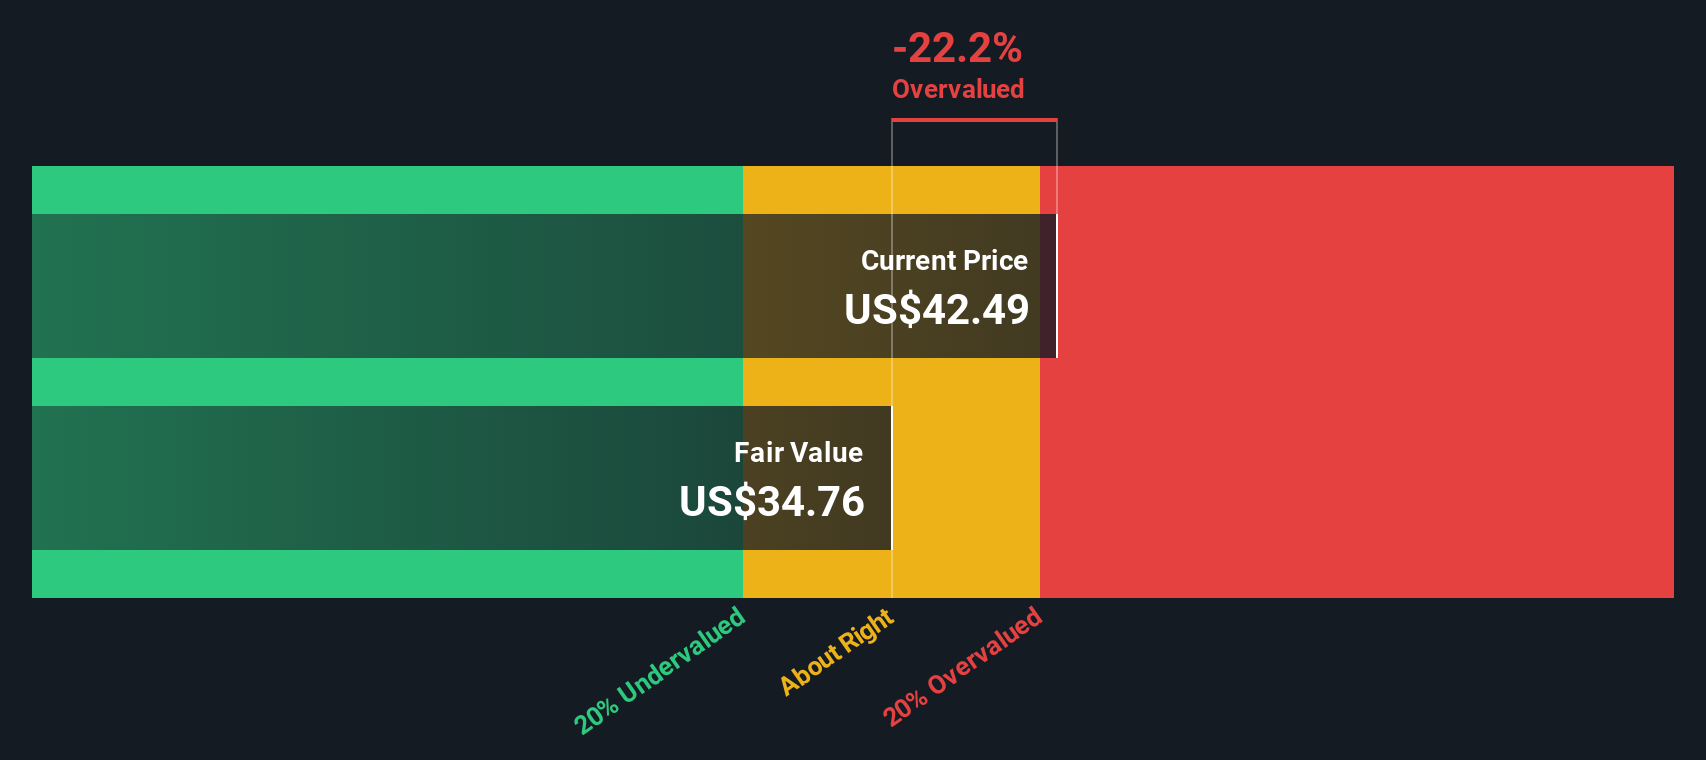
Discounting these projected cash flows back to today gives an estimated intrinsic value of US$50.64 per share. Compared with the recent share price of US$36.51, the model output indicates Bruker trades at a 27.9% discount, which points to the shares being undervalued on this set of assumptions.
Result: UNDERVALUED
Our Discounted Cash Flow (DCF) analysis suggests Bruker is undervalued by 27.9%. Track this in your watchlist or portfolio, or discover 53 more high quality undervalued stocks.
Approach 2: Bruker Price vs Sales
For companies where earnings can be uneven, the P/S ratio is often a practical way to compare what investors are paying for each dollar of revenue. It sidesteps short term earnings swings and gives you a cleaner read on how the market values the business relative to its sales base.
In general, higher expected growth and lower perceived risk can be associated with a higher P/S multiple, while slower growth or higher risk can be associated with a lower, more cautious multiple. So context really matters when you look at any single number.
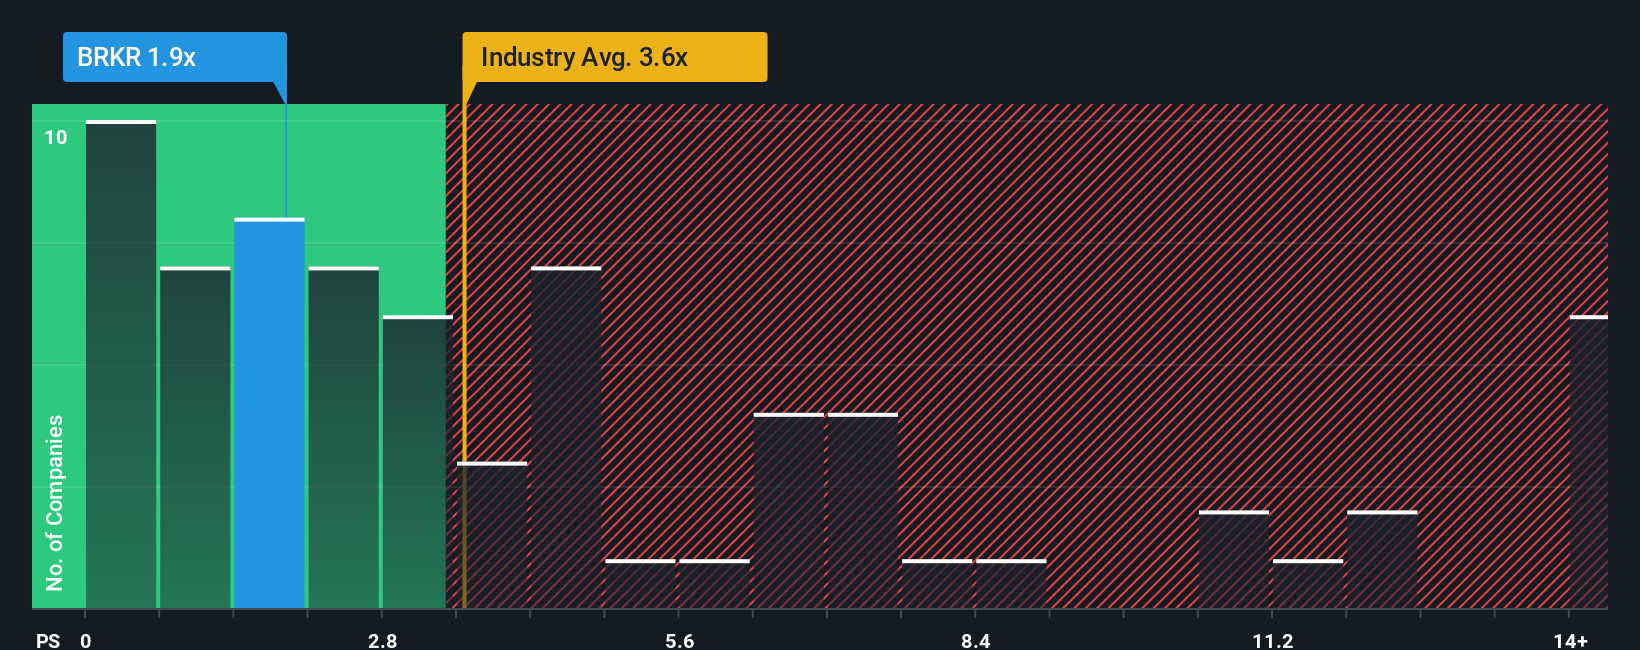
Bruker currently trades on a P/S ratio of 1.61x. That sits below the Life Sciences industry average of 2.77x and also below the peer group average of 2.76x. Simply Wall St’s Fair Ratio for Bruker is 3.39x, which is its proprietary view of what the P/S might be given factors such as the company’s growth profile, profit margins, industry, market cap and risk characteristics.
The Fair Ratio is designed to be more tailored than a simple comparison with peers or the industry because it blends these company specific inputs rather than assuming one size fits all. Set against the current 1.61x P/S, the 3.39x Fair Ratio indicates that Bruker appears undervalued on this metric.
Result: UNDERVALUED
P/S ratios tell one story, but what if the real opportunity lies elsewhere? Start investing in legacies, not executives. Discover our 23 top founder-led companies.
Upgrade Your Decision Making: Choose your Bruker Narrative
Earlier we mentioned that there is an even better way to understand valuation. On Simply Wall St you can use Narratives, short storylines that tie your view of Bruker’s future revenue, earnings and margins to a forecast and a Fair Value. You can then compare that to the current price on the Community page where millions of investors share their views.
A Narrative is simply your story behind the numbers. It connects what you think is happening with Bruker’s products, funding exposure and cost programs to a set of future estimates and a Fair Value that updates as new earnings or news arrives.
For example, one Bruker Narrative might lean closer to the higher Fair Value and price targets around US$63.51 if you think product pipelines, diagnostics exposure and cost savings support stronger growth and margins. Another might sit nearer US$38.00 if you are more focused on funding constraints and demand risks. Seeing these side by side can help you decide whether the gap between Fair Value and today’s price looks attractive, stretched or somewhere in between for your own decision making.
Do you think there's more to the story for Bruker? Head over to our Community to see what others are saying!
This article by Simply Wall St is general in nature. We provide commentary based on historical data and analyst forecasts only using an unbiased methodology and our articles are not intended to be financial advice. It does not constitute a recommendation to buy or sell any stock, and does not take account of your objectives, or your financial situation. We aim to bring you long-term focused analysis driven by fundamental data. Note that our analysis may not factor in the latest price-sensitive company announcements or qualitative material. Simply Wall St has no position in any stocks mentioned.
Have feedback on this article? Concerned about the content? Get in touch with us directly. Alternatively, email editorial-team@simplywallst.com