
- LIVE QUOTES
- LEARN
- HELP
 Nasdaq
 Wall Street Journal
EN
Assessing FuboTV (FUBO) Valuation After Recent Share Price Weakness And Deep Price To Sales Discount
FuboTV (FUBO) has drawn fresh attention as investors reassess its live TV streaming model, with the stock recently closing at US$1.34 after mixed short term share price performance.
See our latest analysis for FuboTV.
That latest move comes after a sharp reset in sentiment, with a 30 day share price return of 48.06% decline and a 90 day share price return of 62.88% decline, pointing to fading momentum despite the modest 1 day share price gain.
If FuboTV’s swings have you reassessing your options, this could be a good moment to widen your search and check out our screener of 23 top founder-led companies.
So, with FuboTV trading at US$1.34, an intrinsic discount flag, a value score of 5, and a large gap to the analyst price target, is this a mispriced opportunity or is the market already factoring in future growth?
Preferred Price-to-Sales of 0.1x: Is it justified?
On the surface, FuboTV’s valuation looks compressed, with the shares at $1.34 and the company trading on a P/S of 0.1x that screens as cheap against both peers and the wider US Interactive Media and Services industry.
The price to sales ratio compares the company’s market value with its revenue, which can be useful for loss making businesses where earnings are not yet a clean guide. For FuboTV, this 0.1x P/S sits against a peer average of 2.5x and an industry average of 0.9x, so the market is currently assigning far less value to each dollar of sales than it does for many competitors.
Given that FuboTV is still unprofitable but has reduced losses over the past 5 years at a rate of 7.7% per year and has earnings forecast to grow very quickly from here, a low P/S can be read as the market heavily discounting those forecasts or focusing on execution risks. At the same time, analysts are in statistically confident agreement that the target price is more than 20% above today’s level, and the stock is also flagged as trading well below an estimate of its future cash flow value using the SWS DCF model, which adds another valuation signal for investors to weigh.
Against the US Interactive Media and Services industry average P/S of 0.9x, FuboTV’s 0.1x ratio stands out as deeply compressed. The gap looks even more extreme when set beside the 2.5x peer average, suggesting the market is pricing FuboTV’s revenue base at a steep discount relative to comparable names.
See what the numbers say about this price — find out in our valuation breakdown.
Result: Price-to-Sales of 0.1x (UNDERVALUED)
However, recent share price declines and ongoing net losses of US$123.672 suggest execution risk remains, particularly if FuboTV’s live TV streaming focus struggles to gain traction.
Find out about the key risks to this FuboTV narrative.
Another View: What Does The SWS DCF Model Say?
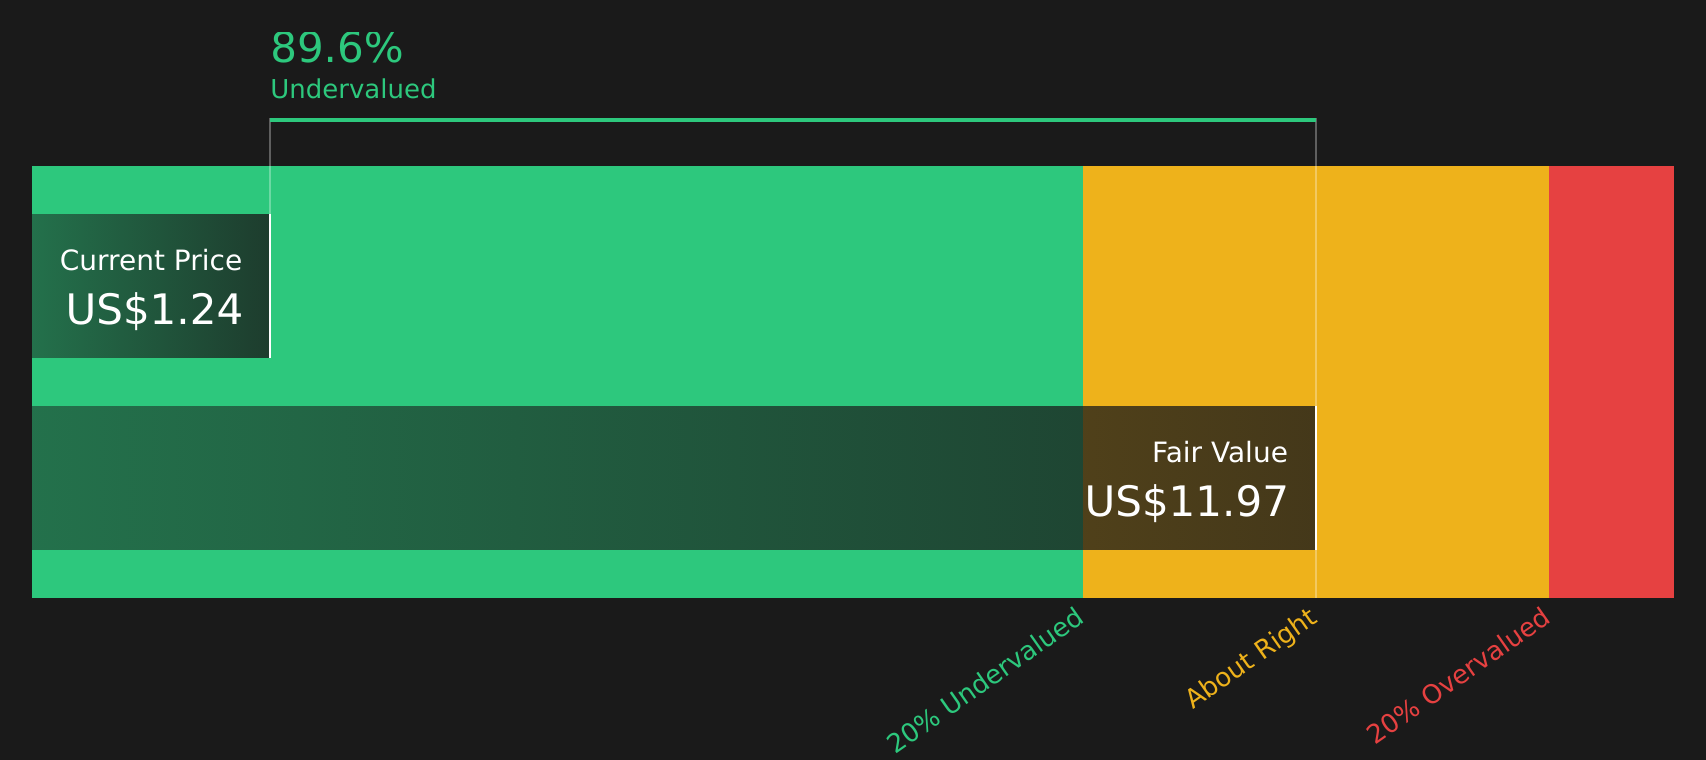
While the 0.1x P/S makes FuboTV look compressed, our DCF model points to a very different picture, with an estimated future cash flow value of $13.61 per share versus the current $1.34. That indicates FuboTV is heavily undervalued using this method, so which signal do you trust more?
Look into how the SWS DCF model arrives at its fair value.
Simply Wall St performs a discounted cash flow (DCF) on every stock in the world every day (check out FuboTV for example). We show the entire calculation in full. You can track the result in your watchlist or portfolio and be alerted when this changes, or use our stock screener to discover 53 high quality undervalued stocks. If you save a screener we even alert you when new companies match - so you never miss a potential opportunity.
Build Your Own FuboTV Narrative
If you look at the numbers and reach a different conclusion, or simply prefer to test your own assumptions directly, you can build a personalised view in just a few minutes using Do it your way.
A good starting point is our analysis highlighting 4 key rewards investors are optimistic about regarding FuboTV.
Looking for more investment ideas?
If you are weighing up FuboTV, do not stop there. Casting a wider net across different types of opportunities can sharpen your next investing move.
- Hunt for potential value candidates that combine quality and a gap to estimated worth with our 53 high quality undervalued stocks.
- Prioritise resilience by scanning companies that show robust finances and conservative leverage through the solid balance sheet and fundamentals stocks screener (44 results).
- Spot under the radar opportunities that have not attracted much attention yet using the screener containing 23 high quality undiscovered gems.
This article by Simply Wall St is general in nature. We provide commentary based on historical data and analyst forecasts only using an unbiased methodology and our articles are not intended to be financial advice. It does not constitute a recommendation to buy or sell any stock, and does not take account of your objectives, or your financial situation. We aim to bring you long-term focused analysis driven by fundamental data. Note that our analysis may not factor in the latest price-sensitive company announcements or qualitative material. Simply Wall St has no position in any stocks mentioned.
Have feedback on this article? Concerned about the content? Get in touch with us directly. Alternatively, email editorial-team@simplywallst.com