
- LIVE QUOTES
- LEARN
- HELP
 Nasdaq
 Wall Street Journal
EN
Is Dover (DOV) Fairly Priced After Strong Multi Year Share Price Gains
- If you are wondering whether Dover's current share price still offers value, this article will walk through the numbers in a clear, grounded way so you can judge for yourself.
- With the stock at US$231.63, recent returns of 3.6% over 7 days, 13.4% over 30 days, 18.3% year to date, 15.8% over 1 year, 54.7% over 3 years and 102.1% over 5 years give useful context for how the market has been pricing Dover recently.
- Recent news coverage around Dover has focused on its positioning within the capital goods sector and how investors are weighing its long term prospects against current valuations. This backdrop helps explain why the stock's recent performance has been closely watched by investors assessing whether the current price still stacks up.
- Dover currently has a valuation score of 3/6, which reflects how it screens across several pricing checks. Next we will look at those methods in more detail, before finishing with an even more useful way to think about valuation overall.
Find out why Dover's 15.8% return over the last year is lagging behind its peers.
Approach 1: Dover Discounted Cash Flow (DCF) Analysis
A Discounted Cash Flow, or DCF, model takes estimates of a company’s future cash flows and discounts them back to today using a required rate of return to arrive at an estimated value per share.
For Dover, the model used is a 2 Stage Free Cash Flow to Equity approach based on cash flow projections. The latest twelve month free cash flow is about $1,137.1 million. Analyst estimates and Simply Wall St extrapolations indicate projected free cash flow of around $1,331.6 million in 2026 and $1,780.0 million by 2029, with further projections out to 2035 included in the calculation.
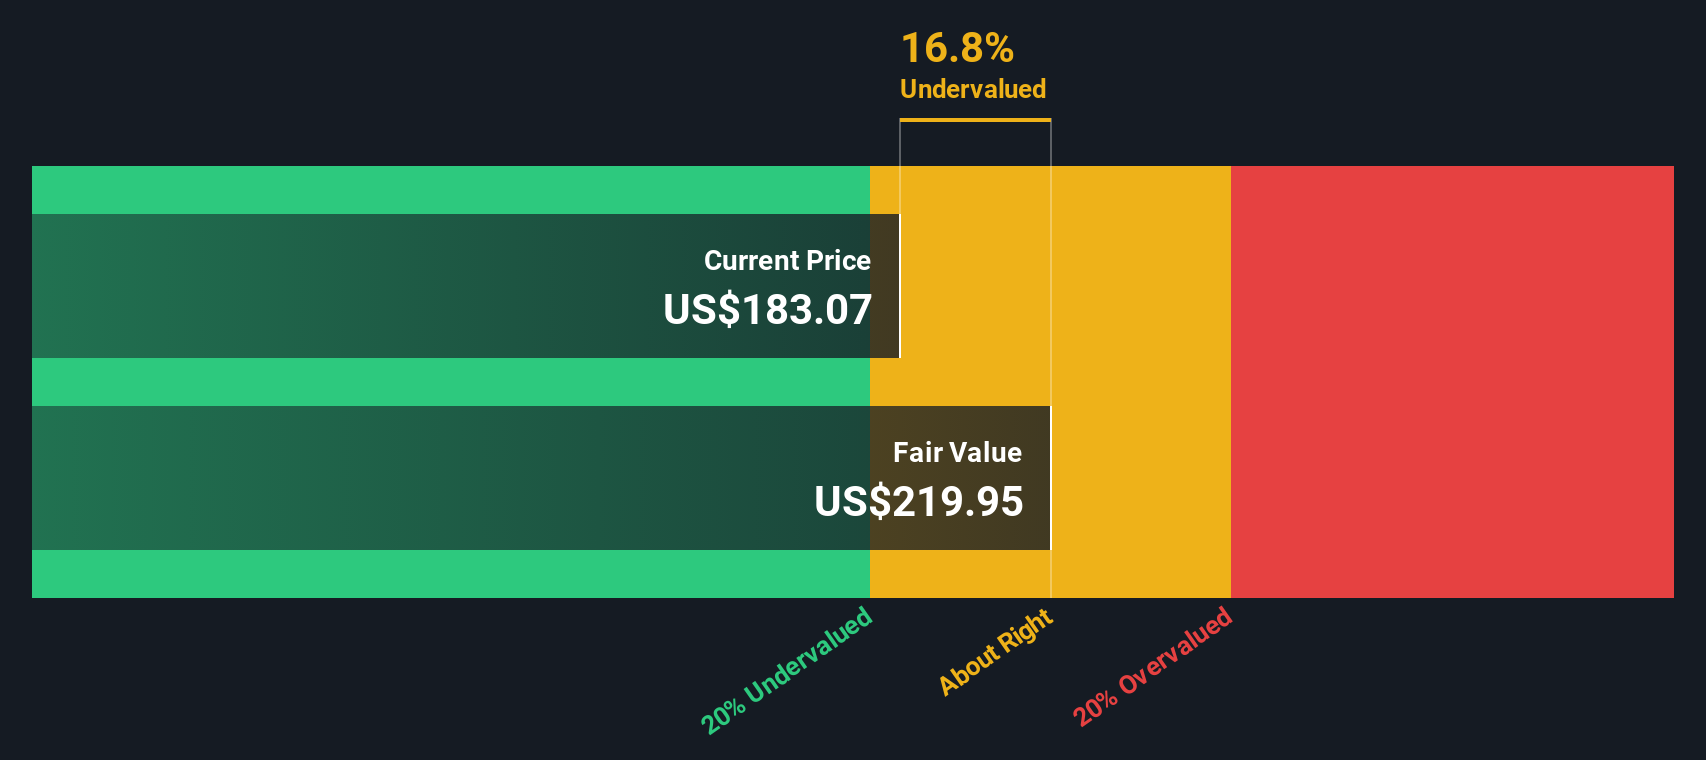
Bringing all those future cash flows back to today in the DCF results in an estimated intrinsic value of about $234.27 per share. Compared with the current share price of $231.63, the model suggests Dover is around 1.1% undervalued, which is effectively in the same ballpark as the market price.
Result: ABOUT RIGHT
Dover is fairly valued according to our Discounted Cash Flow (DCF), but this can change at a moment's notice. Track the value in your watchlist or portfolio and be alerted on when to act.
Approach 2: Dover Price vs Earnings
For a profitable company like Dover, the P/E ratio is a straightforward way to see how much you are paying for each dollar of current earnings. Investors typically accept a higher or lower P/E depending on what they expect for future growth and how risky they see those earnings to be, so there is no single "right" P/E, just a range that fits the business profile.
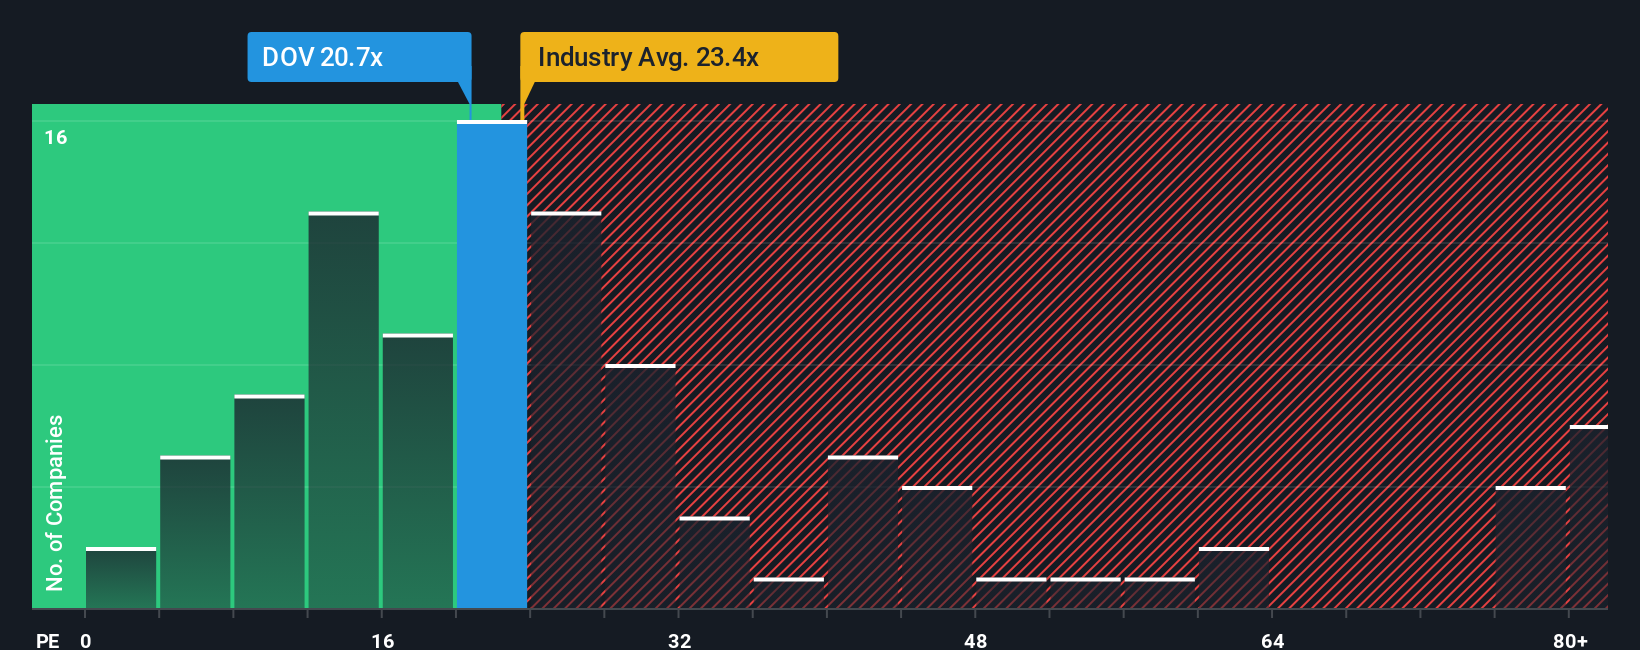
Dover currently trades on a P/E of 28.95x. That sits just below the Machinery industry average of about 29.89x and below the peer group average of roughly 36.16x. Simply Wall St’s Fair Ratio, at 27.67x, is its own estimate of what a reasonable P/E for Dover could be, given factors like earnings growth, profit margins, size and specific risks.
This Fair Ratio is more tailored than a simple comparison with peers or the broad industry because it adjusts for Dover’s own characteristics rather than assuming all Machinery companies deserve the same multiple. With the current P/E of 28.95x sitting close to the Fair Ratio of 27.67x, the stock looks broadly in line with what this framework suggests.
Result: ABOUT RIGHT
P/E ratios tell one story, but what if the real opportunity lies elsewhere? Start investing in legacies, not executives. Discover our 23 top founder-led companies.
Upgrade Your Decision Making: Choose your Dover Narrative
Earlier we mentioned that there is an even better way to understand valuation. On Simply Wall St you can use Narratives, where you set out your story for Dover, connect it to your own revenue, earnings and margin assumptions, translate that into a fair value, then compare it with the current price. Because Narratives on the Community page are updated when fresh news or earnings arrive, you can see, for example, one investor using the highest analyst target of US$235.00 and another using the lowest at US$168.00. Each has very different views on how AI demand, margin execution, portfolio changes and risk factors might play out. This gives you a clear, easy to follow framework for deciding whether the current price lines up with the version of the story you find most reasonable.
Do you think there's more to the story for Dover? Head over to our Community to see what others are saying!

This article by Simply Wall St is general in nature. We provide commentary based on historical data and analyst forecasts only using an unbiased methodology and our articles are not intended to be financial advice. It does not constitute a recommendation to buy or sell any stock, and does not take account of your objectives, or your financial situation. We aim to bring you long-term focused analysis driven by fundamental data. Note that our analysis may not factor in the latest price-sensitive company announcements or qualitative material. Simply Wall St has no position in any stocks mentioned.
Have feedback on this article? Concerned about the content? Get in touch with us directly. Alternatively, email editorial-team@simplywallst.com