
- LIVE QUOTES
- LEARN
- HELP
 Nasdaq
 Wall Street Journal
EN
Is Nexstar Media Group (NXST) Pricing In Its Recent 56% One Year Share Price Jump?
- If you are wondering whether Nexstar Media Group's current share price reflects its true worth, you are not alone. This article is set up to help you unpack what the numbers might be saying.
- With the stock at US$231.18 after returns of 4.5% over 7 days, 8.8% over 30 days, 10.7% year to date and 56.4% over 1 year, plus 29.7% over 3 years and 117.1% over 5 years, many investors are asking what kind of value is now baked into the price.
- Recent coverage has focused on Nexstar Media Group's position as a large US media group and how its scale and assets fit into broader industry themes, giving investors additional context around the share price moves you are seeing. This backdrop matters because it shapes how the market may be framing both the opportunities and the risks attached to the stock today.
- Nexstar Media Group currently has a value score of 5/6, which reflects how many of our valuation checks indicate the shares may be undervalued. Next we will walk through the main valuation approaches used, then finish with a broader way to think about whether that score really captures the full picture.
Approach 1: Nexstar Media Group Discounted Cash Flow (DCF) Analysis
A DCF model takes estimates of future cash flows, then discounts them back to today to arrive at an implied value per share. It is essentially asking what all of Nexstar Media Group’s future cash generation is worth in today’s dollars.
For Nexstar, the model uses a 2 Stage Free Cash Flow to Equity approach based on cash flow projections. The company’s latest twelve month Free Cash Flow stands at about $964.1 million. Analysts provide explicit forecasts out to 2029, with Simply Wall St extrapolating the later years. For example, projected Free Cash Flow for 2029 is $973 million, and the ten year projection set runs from $1,206.8 million in 2026 to $1,030.4 million in 2035, all in $ terms.
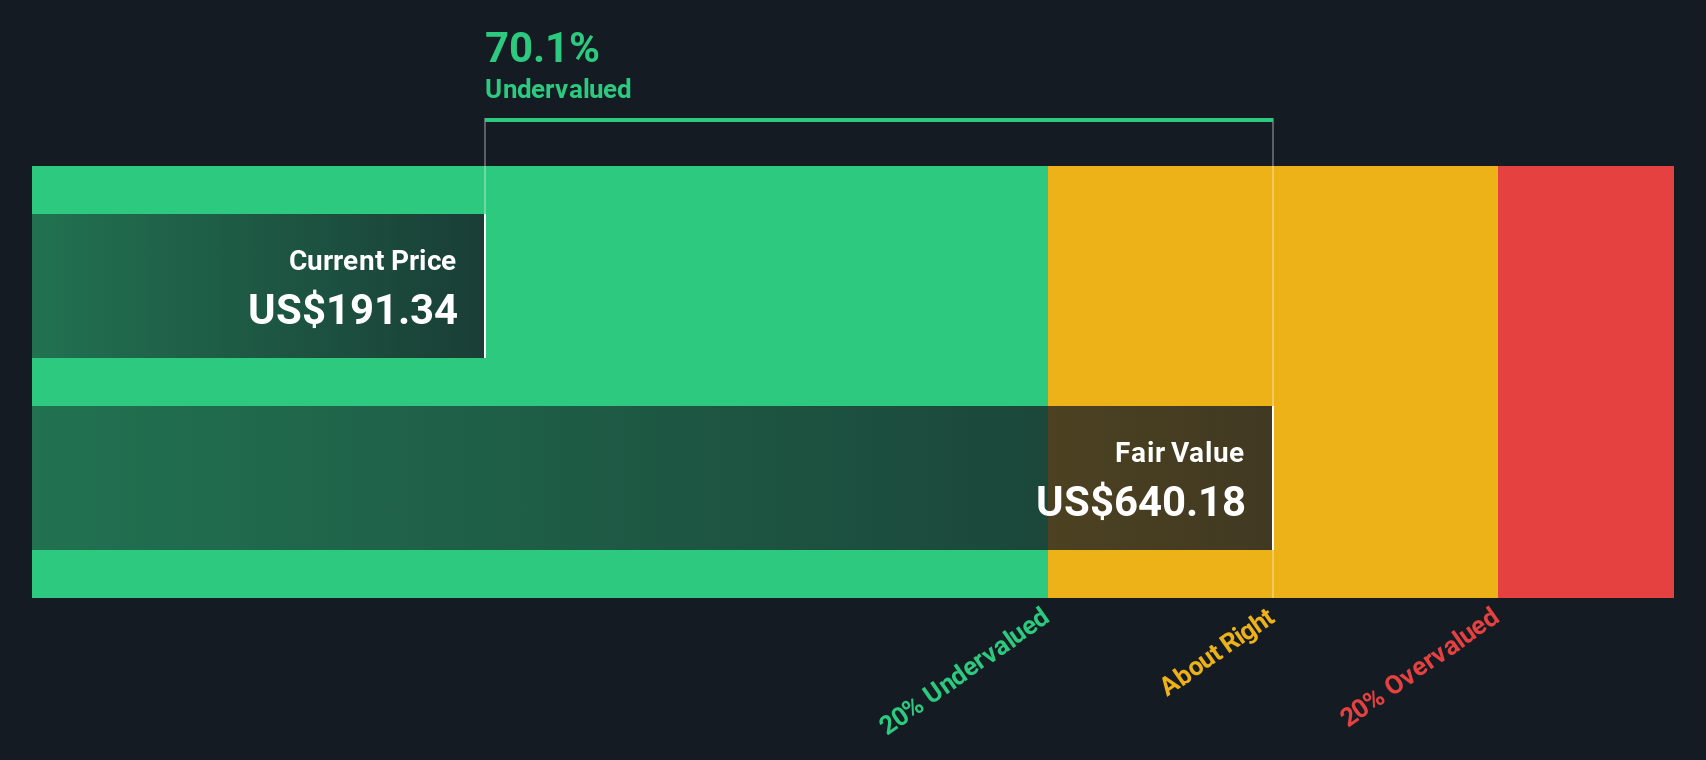
Discounting these future cash flows back to today gives an estimated intrinsic value of $573.63 per share. Compared with the recent share price of $231.18, the DCF output indicates the stock is 59.7% undervalued on this model.
Result: UNDERVALUED
Our Discounted Cash Flow (DCF) analysis suggests Nexstar Media Group is undervalued by 59.7%. Track this in your watchlist or portfolio, or discover 55 more high quality undervalued stocks.
Approach 2: Nexstar Media Group Price vs Earnings
For profitable companies like Nexstar Media Group, the P/E ratio is a useful shorthand for how much investors are currently paying for each dollar of earnings. It ties the share price directly to the business’s bottom line, which is usually what drives long term returns.
What counts as a “normal” or “fair” P/E depends on how the market sees a company’s growth prospects and risks. Higher expected growth or lower perceived risk can support a higher P/E, while slower growth or higher risk typically justifies a lower P/E.
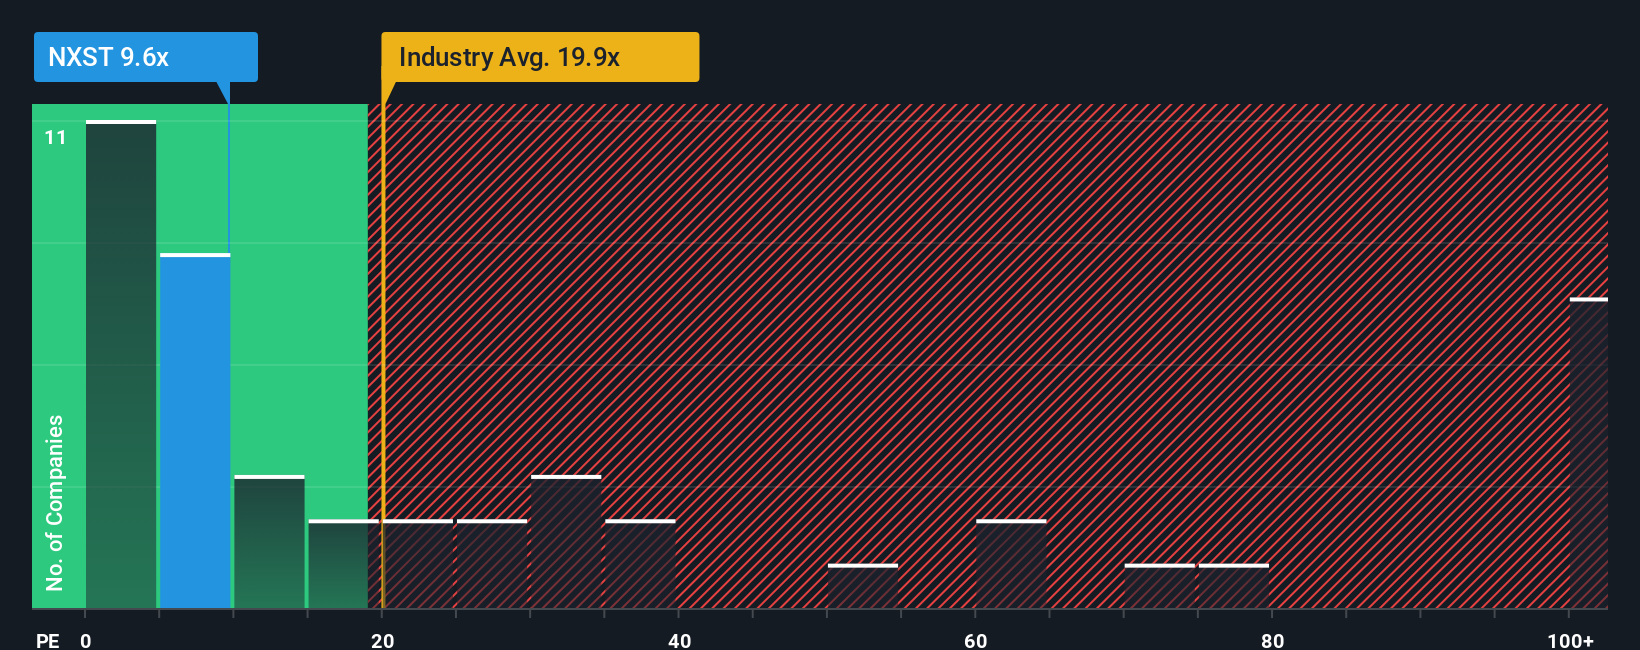
Nexstar’s current P/E is 13.99x. That sits close to the broader Media industry average of 14.56x and below the peer group average of 24.69x. Simply Wall St also calculates a Fair Ratio of 19.64x, which reflects the P/E you might expect once factors like earnings growth, profit margin, size, industry and company specific risks are considered together.
This Fair Ratio can be more informative than a simple comparison with industry or peers because it adjusts for Nexstar’s own characteristics rather than assuming all media companies should trade on similar multiples. With the current P/E below the Fair Ratio, this approach indicates that Nexstar Media Group appears undervalued on an earnings basis.
Result: UNDERVALUED
P/E ratios tell one story, but what if the real opportunity lies elsewhere? Start investing in legacies, not executives. Discover our 23 top founder-led companies.
Upgrade Your Decision Making: Choose your Nexstar Media Group Narrative
Earlier we mentioned that there is an even better way to understand valuation, so let us introduce you to Narratives, which are simply your story about Nexstar Media Group, tied directly to your assumptions for fair value, future revenue, earnings and margins, then compared with today’s share price. On Simply Wall St, Narratives live in the Community page and are used by millions of investors as an easy tool that links a company’s qualitative story to a structured forecast and an implied fair value that updates automatically when new information like earnings or deal news is released. For Nexstar, one investor might focus on trusted local news, digital expansion, political ad revenue and potential M&A benefits and end up closer to the higher US$250 fair value. Another might focus on pay TV pressure, debt and regulatory risk and land nearer the lower US$190 view. By comparing any Narrative’s fair value with the current price, you get a clearer framework for deciding whether Nexstar now looks closer to an opportunity or something to be cautious about, based on your own assumptions.
Do you think there's more to the story for Nexstar Media Group? Head over to our Community to see what others are saying!

This article by Simply Wall St is general in nature. We provide commentary based on historical data and analyst forecasts only using an unbiased methodology and our articles are not intended to be financial advice. It does not constitute a recommendation to buy or sell any stock, and does not take account of your objectives, or your financial situation. We aim to bring you long-term focused analysis driven by fundamental data. Note that our analysis may not factor in the latest price-sensitive company announcements or qualitative material. Simply Wall St has no position in any stocks mentioned.
Have feedback on this article? Concerned about the content? Get in touch with us directly. Alternatively, email editorial-team@simplywallst.com