
- LIVE QUOTES
- LEARN
- HELP
 Nasdaq
 Wall Street Journal
EN
Does PENN Entertainment (PENN) Offer Value After Multi‑Year Share Price Slump
- If you are wondering whether PENN Entertainment's current share price reflects its true worth, this article walks through what the numbers are really saying about the stock.
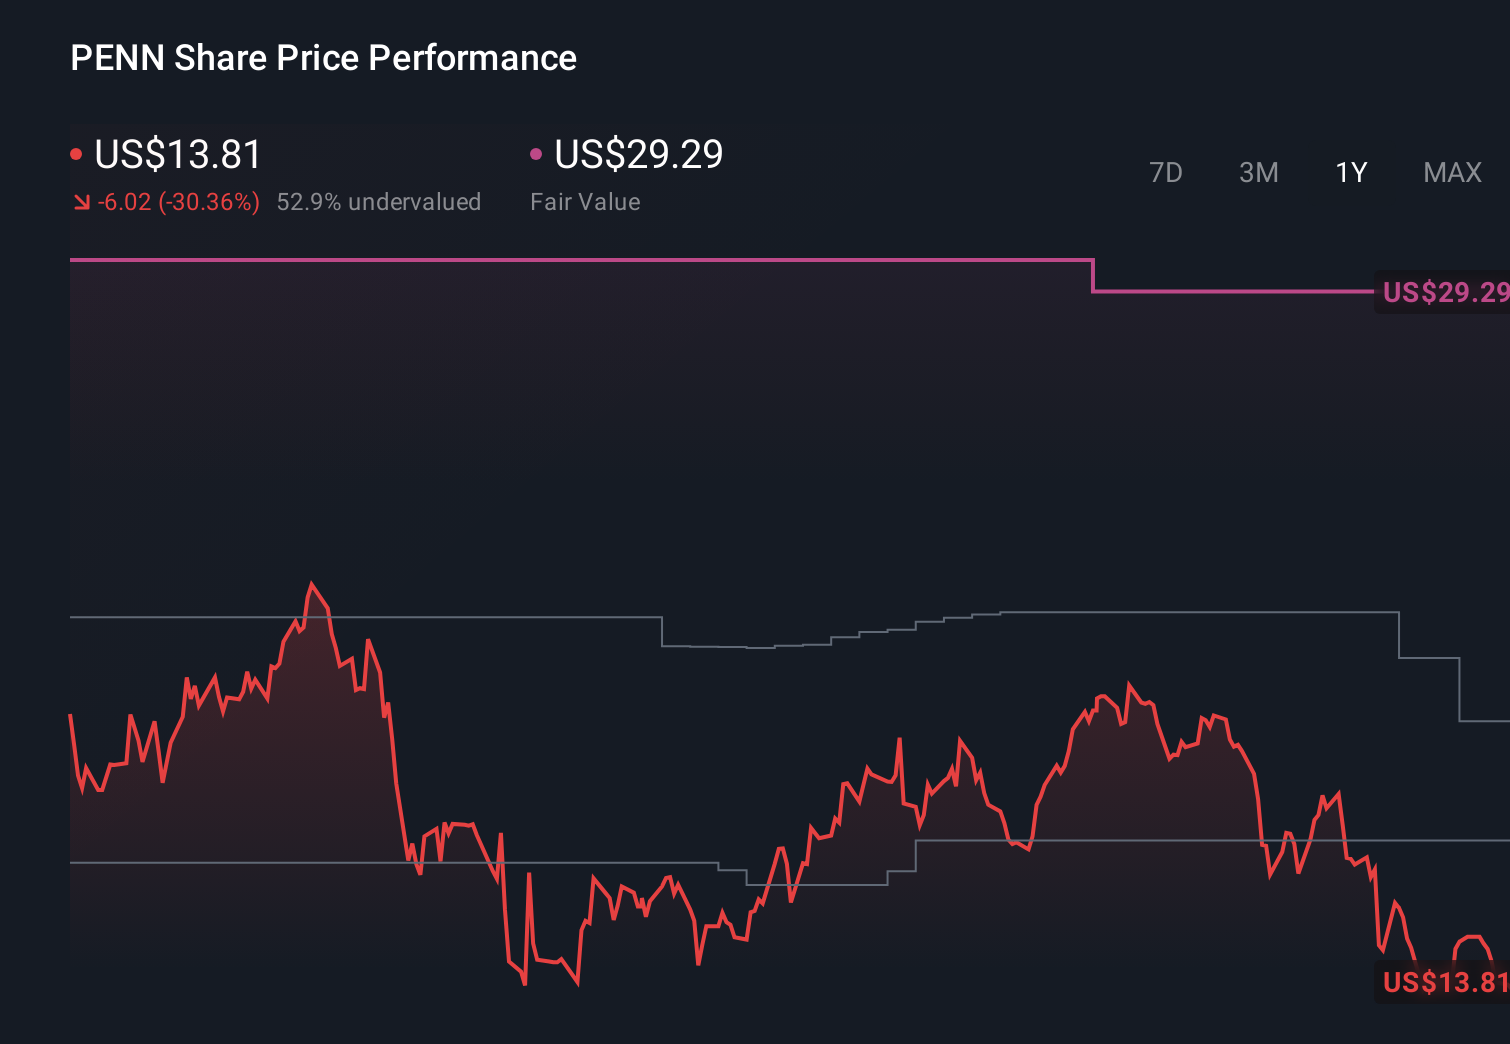
- Over shorter timeframes, the stock has been mixed, with a 0.2% move over the last week, a 10.3% decline over the past month, a 16.4% decline year to date, and a 44.7% decline over the last year, adding to a 61.4% decline over three years and an 89.3% decline over five years.
- Recent attention on PENN has largely focused on how its current business position and market sentiment line up with the share price, as investors reassess what they are willing to pay for the stock. This context helps explain why the market is closely watching any updates around PENN's operations, partnerships, or industry conditions.
- Despite this share price history, PENN Entertainment currently scores 6 out of 6 on our valuation checks, as shown in our valuation score. Next, we will look at traditional valuation methods like DCF and multiples, then finish with a more complete way of thinking about value that goes beyond a single model.
Find out why PENN Entertainment's -44.7% return over the last year is lagging behind its peers.
Approach 1: PENN Entertainment Discounted Cash Flow (DCF) Analysis
A Discounted Cash Flow model estimates what a business could be worth by projecting its future cash flows and then discounting those back to today, so you can compare that value with the current share price.
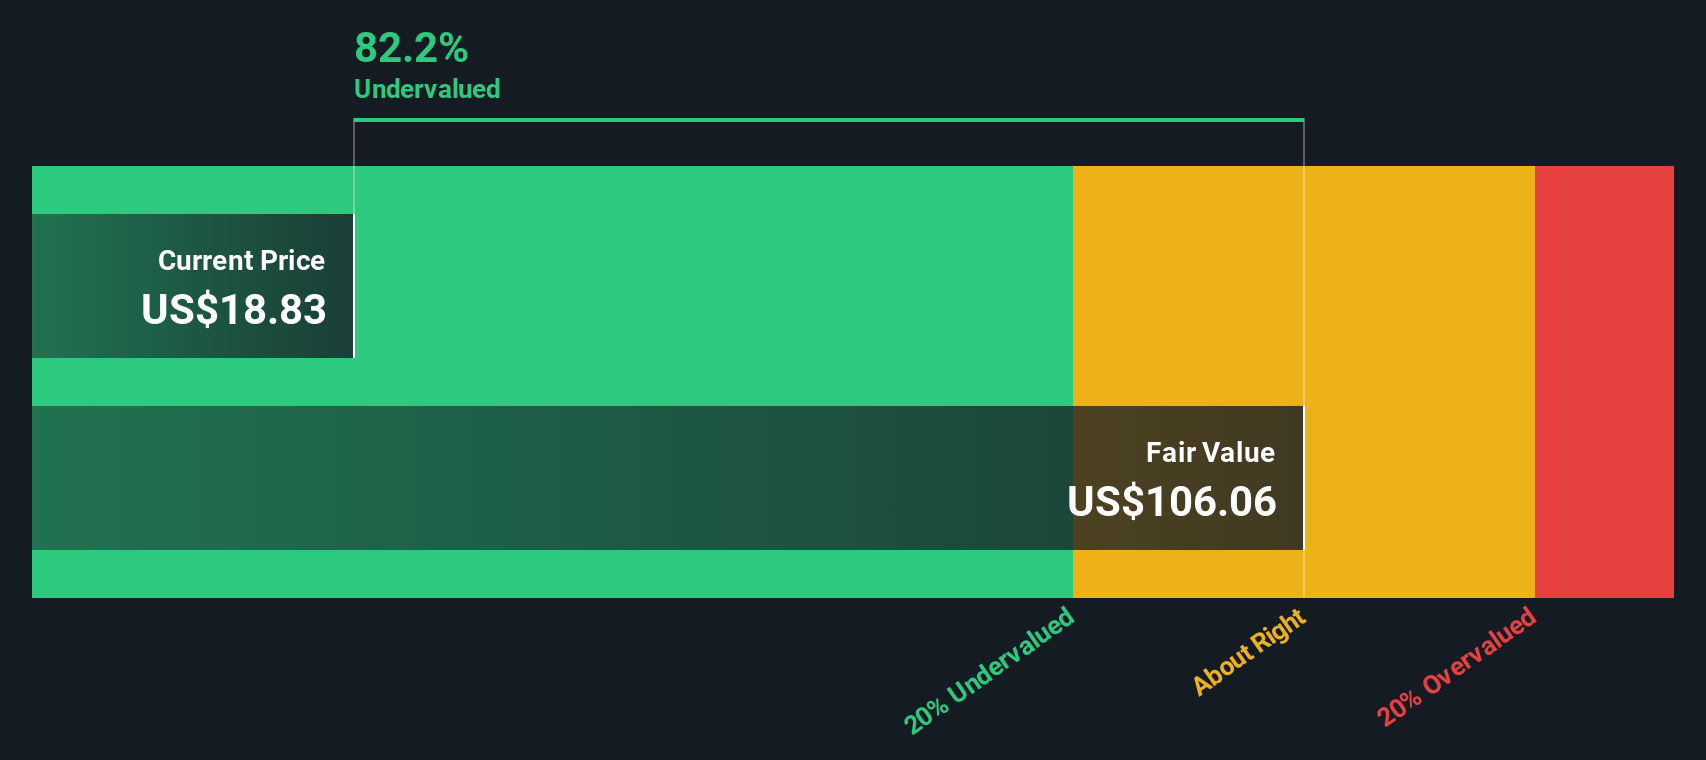
For PENN Entertainment, the 2 Stage Free Cash Flow to Equity model starts from last twelve months free cash flow of about $11.9 million in outflows and then uses a mix of analyst inputs and extrapolated figures. Analysts provide specific free cash flow estimates out to 2027, with $211.45 million in 2026 and $362 million in 2027. Beyond that, Simply Wall St extends the projections through 2035, with discounted free cash flows running from about $188.24 million up to $413.54 million and then $355.67 million in the later years of the forecast period.
When all of those discounted cash flows are added together, the model arrives at an estimated intrinsic value of $57.67 per share. Compared with the current share price, this implies the stock is 78.5% undervalued on this DCF view.
Result: UNDERVALUED
Our Discounted Cash Flow (DCF) analysis suggests PENN Entertainment is undervalued by 78.5%. Track this in your watchlist or portfolio, or discover 55 more high quality undervalued stocks.
Approach 2: PENN Entertainment Price vs Sales
For companies where earnings can be uneven, the P/S ratio is often a useful cross check because it compares what you pay for each dollar of revenue, rather than profit. It helps you see how the market values the business model itself, without getting caught up in short term earnings swings.
What counts as a fair P/S depends on how quickly investors expect revenue to grow and how risky those cash flows appear. Higher growth and lower perceived risk usually justify a higher multiple, while slower growth or higher risk tend to pull it down.
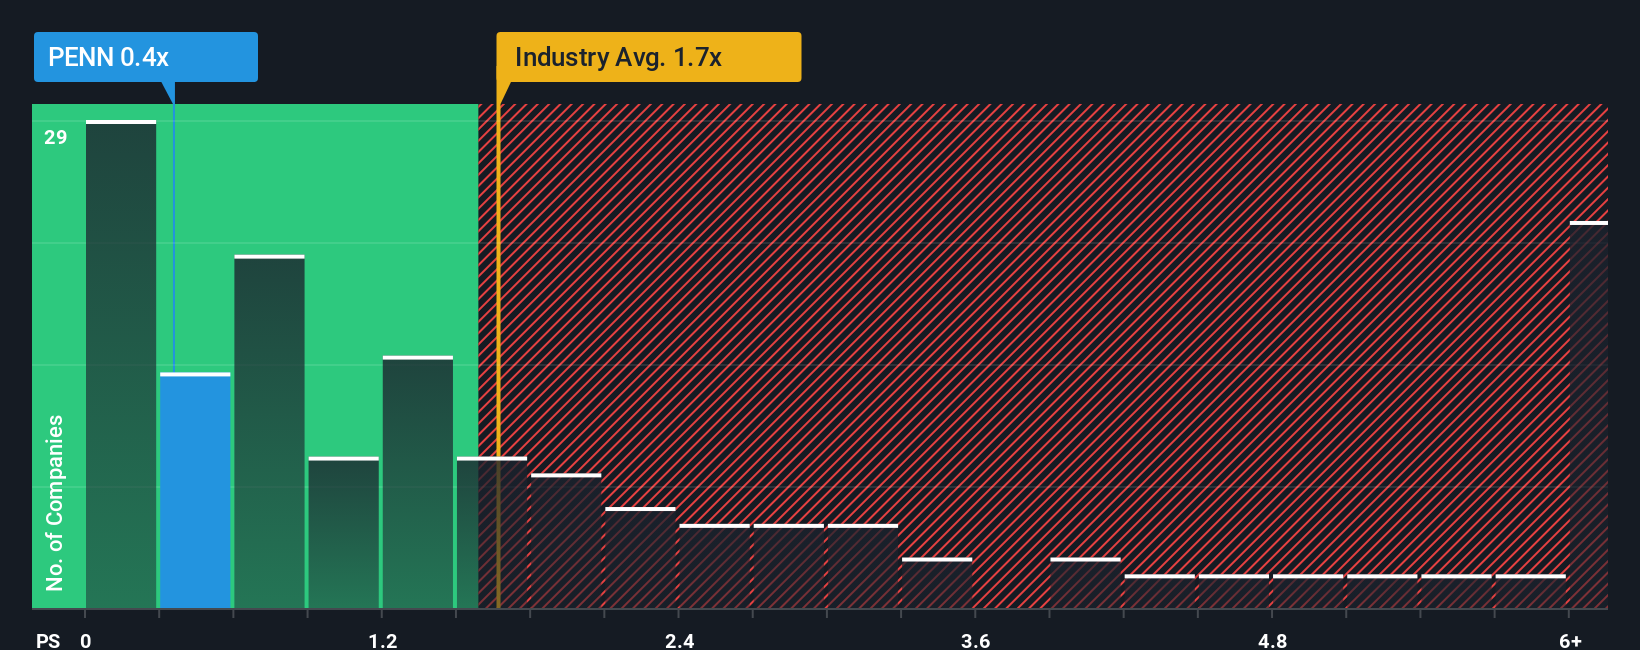
PENN Entertainment currently trades on a P/S of 0.24x. That is well below the Hospitality industry average of 1.60x and also below the peer group average of 1.34x. Simply Wall St’s Fair Ratio for PENN is 1.01x, which reflects a model that factors in elements like earnings growth, profit margins, industry, market cap and company specific risks. This Fair Ratio can be more informative than simple peer or industry comparisons because it adjusts expectations to PENN’s own profile rather than assuming it should be valued like an average company.
Comparing the Fair Ratio of 1.01x with the current 0.24x suggests PENN Entertainment’s shares are undervalued on a P/S basis.
Result: UNDERVALUED
P/S ratios tell one story, but what if the real opportunity lies elsewhere? Start investing in legacies, not executives. Discover our 23 top founder-led companies.
Upgrade Your Decision Making: Choose your PENN Entertainment Narrative
Earlier we mentioned that there is an even better way to understand valuation. On Simply Wall St you can use Narratives, which are simple stories that you and other investors attach to the numbers by linking a view on PENN Entertainment's future revenues, earnings, margins and risks to a forecast. This is then turned into a Fair Value that you can compare with the current share price, track on the Community page that is used by millions of investors, and see update automatically when fresh news or earnings arrive. One investor might back a more optimistic PENN Narrative with a Fair Value around US$25.25, while another might prefer a cautious PENN Narrative closer to US$15. By seeing both side by side, you can quickly decide which story fits your own assumptions about the business and whether the price looks high, low or about right for you.
Do you think there's more to the story for PENN Entertainment? Head over to our Community to see what others are saying!
This article by Simply Wall St is general in nature. We provide commentary based on historical data and analyst forecasts only using an unbiased methodology and our articles are not intended to be financial advice. It does not constitute a recommendation to buy or sell any stock, and does not take account of your objectives, or your financial situation. We aim to bring you long-term focused analysis driven by fundamental data. Note that our analysis may not factor in the latest price-sensitive company announcements or qualitative material. Simply Wall St has no position in any stocks mentioned.
Have feedback on this article? Concerned about the content? Get in touch with us directly. Alternatively, email editorial-team@simplywallst.com