
- LIVE QUOTES
- LEARN
- HELP
 Nasdaq
 Wall Street Journal
EN
Is Tencent Music Entertainment Group (TME) Mispriced After Recent Share Price Weakness
- If you are wondering whether Tencent Music Entertainment Group's current share price reflects its true worth, you are not alone. This article is built to help you make sense of the numbers.
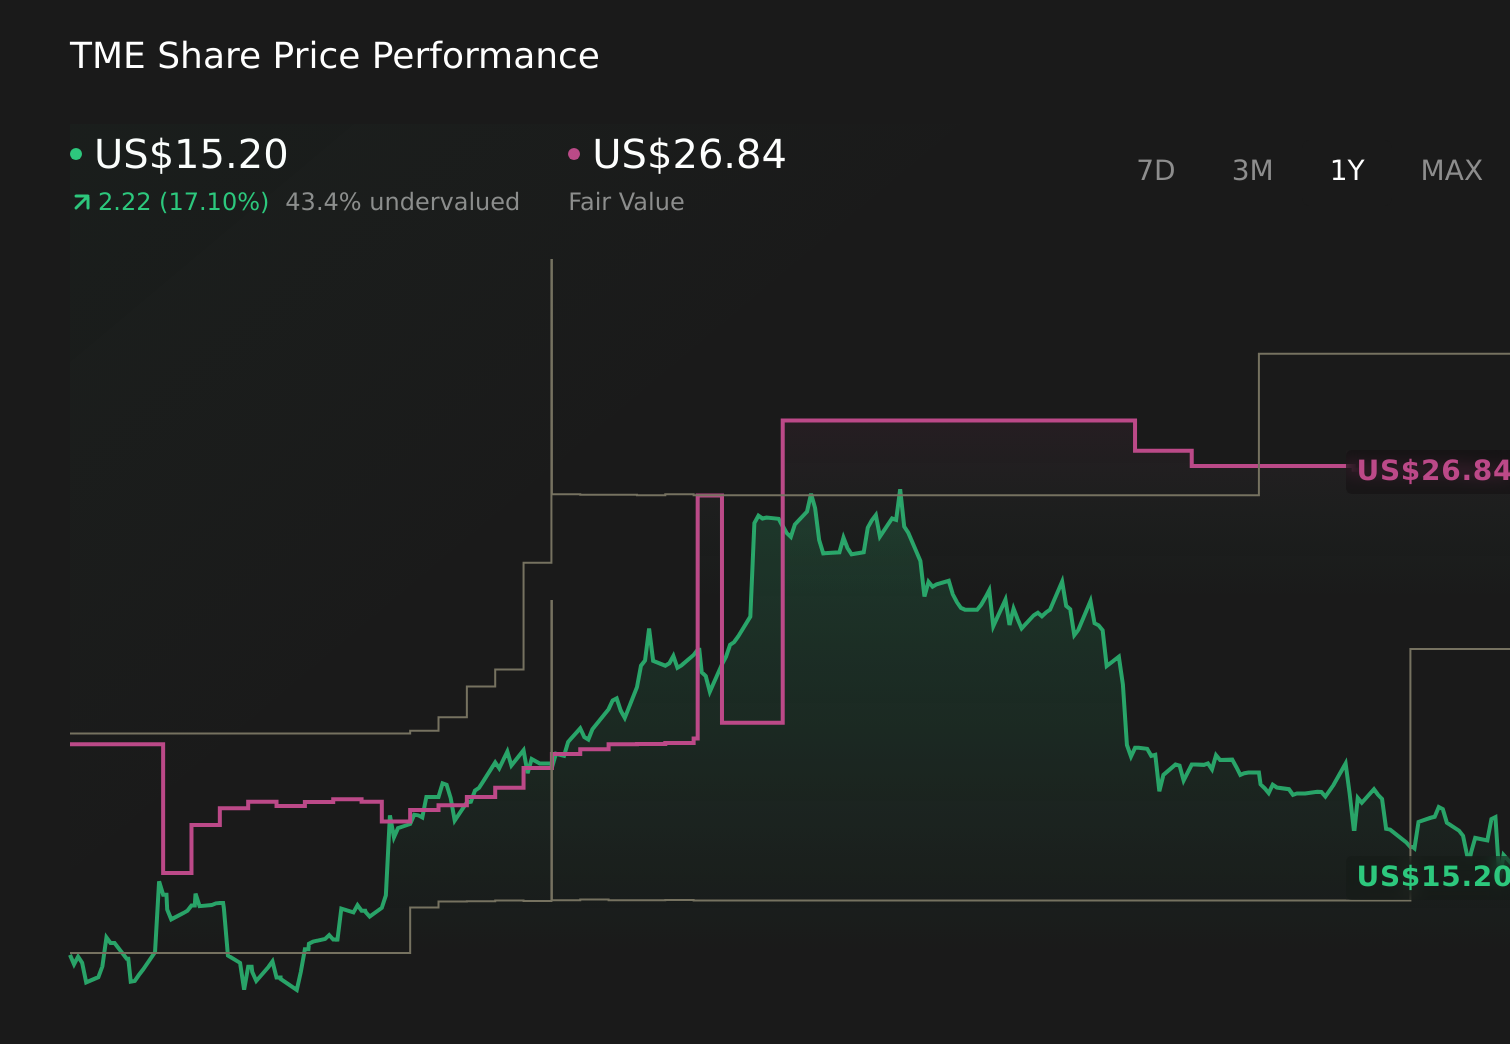
- The stock closed at US$15.15, with returns of a 4.9% decline over the last 7 days, a 13.8% decline over 30 days, a 15.2% decline year to date, a 20.2% gain over 1 year, an 87.1% gain over 3 years, and a 42.3% decline over 5 years. Recent moves therefore sit within a mixed longer term picture.
- Recent headlines around Tencent Music have focused on its role in China's online entertainment market and ongoing product updates, which help frame how investors react to new information about the business. These developments give useful context for the recent share price swings, especially for anyone trying to understand whether sentiment is keeping up with fundamentals.
- Our valuation checks currently give Tencent Music Entertainment Group a score of 6 out of 6. Next we will walk through what that means across different valuation methods, before finishing with a way to look at value that goes beyond the usual models.
Approach 1: Tencent Music Entertainment Group Discounted Cash Flow (DCF) Analysis
A Discounted Cash Flow, or DCF, model estimates what a business could be worth by projecting its future cash flows and then discounting those amounts back to today. It aims to answer a simple question for you: what are those future CN¥ cash flows worth in present terms?
For Tencent Music Entertainment Group, the model used is a 2 Stage Free Cash Flow to Equity approach based on cash flow projections. The latest twelve month free cash flow is CN¥9.15b. Analyst inputs are available up to 2029, and Simply Wall St extrapolates beyond that, with projected free cash flow of CN¥17.01b in 2030 and further estimates running out to 2035.
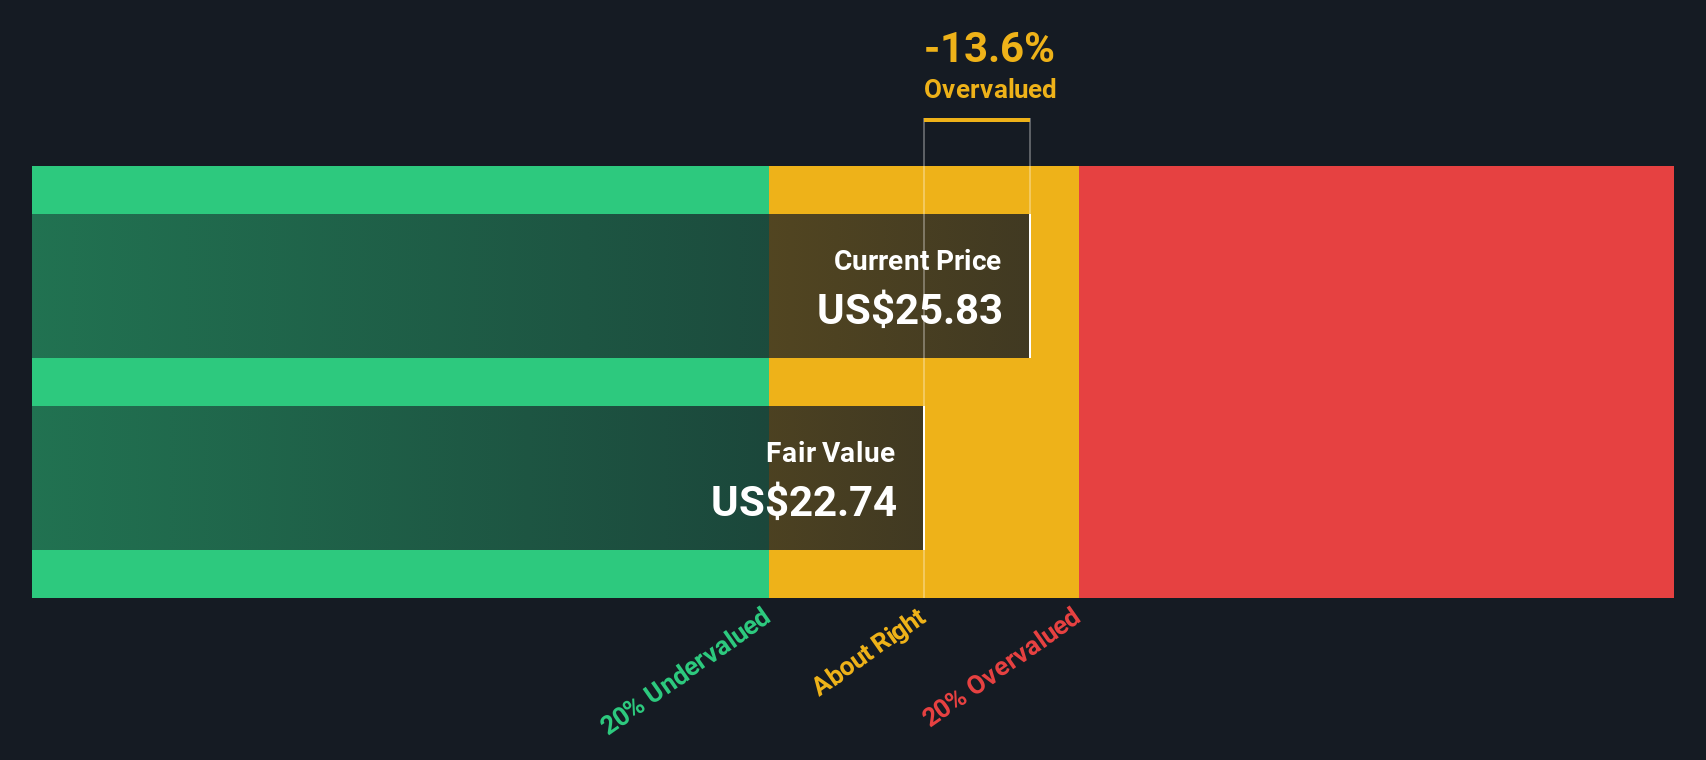
Bringing all those projected CN¥ cash flows back to today gives an estimated intrinsic value of US$22.90 per share. Against the recent share price of US$15.15, this points to an implied 33.9% discount, which suggests the shares are currently priced below this DCF estimate.
Result: UNDERVALUED
Our Discounted Cash Flow (DCF) analysis suggests Tencent Music Entertainment Group is undervalued by 33.9%. Track this in your watchlist or portfolio, or discover 55 more high quality undervalued stocks.
Approach 2: Tencent Music Entertainment Group Price vs Earnings
For profitable companies, the P/E ratio is a useful yardstick because it links what you are paying directly to the earnings the business is already generating. It is a quick way to see how much the market is willing to pay for each dollar of current earnings.
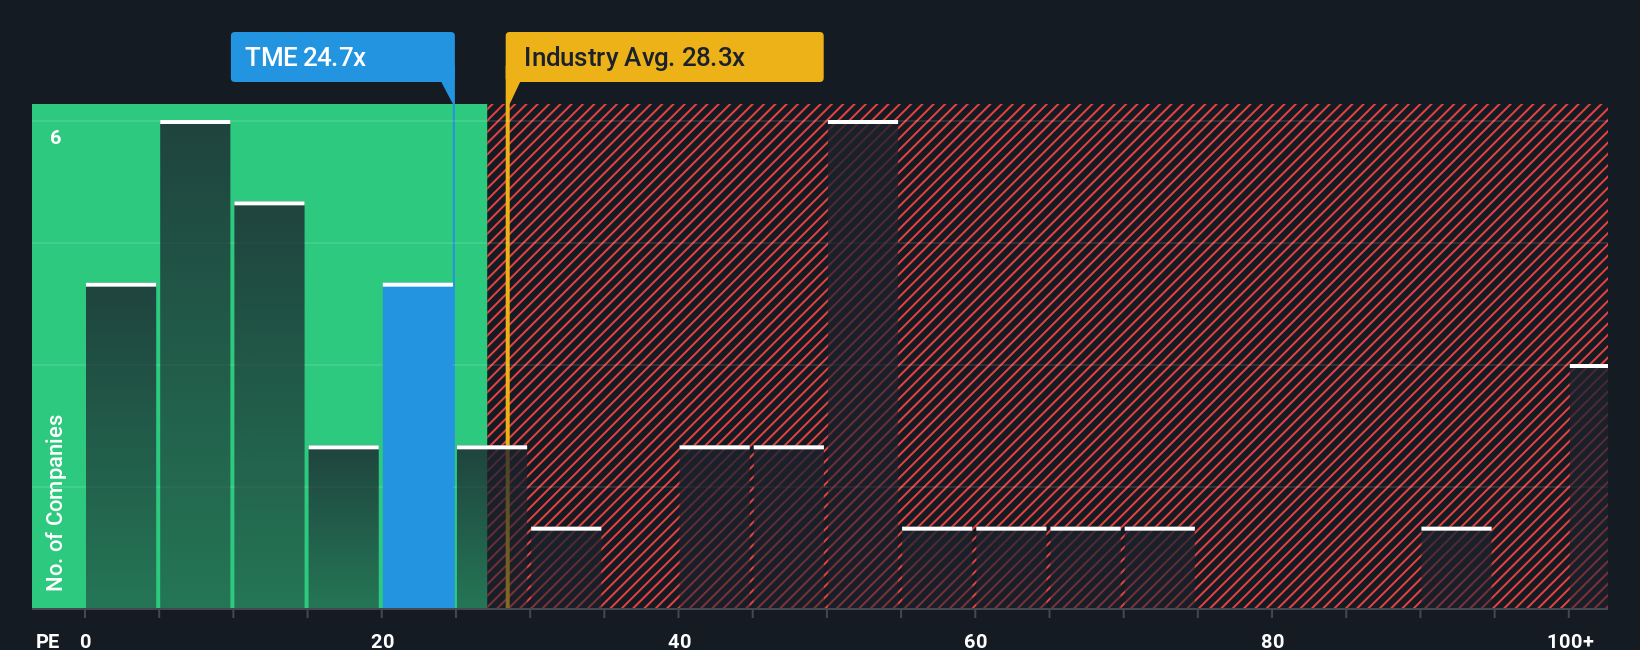
What counts as a "normal" P/E depends a lot on how the market views a company’s growth prospects and risks. Higher expected growth or lower perceived risk tends to support a higher P/E, while more uncertainty usually means a lower multiple. Tencent Music Entertainment Group currently trades on a P/E of 14.98x, compared with an Entertainment industry average of 29.25x and a peer group average of 99.76x.
Simply Wall St’s Fair Ratio for Tencent Music is 23.25x. This is a proprietary estimate of what the P/E might look like given factors such as earnings growth characteristics, profit margins, industry, market cap and specific risks. Because it adjusts for these company level features, it is a more tailored guide than a simple comparison with peers or the broad industry. With the current P/E at 14.98x versus a Fair Ratio of 23.25x, the shares currently appear to trade below this Fair Ratio benchmark.
Result: UNDERVALUED
P/E ratios tell one story, but what if the real opportunity lies elsewhere? Start investing in legacies, not executives. Discover our 23 top founder-led companies.
Upgrade Your Decision Making: Choose your Tencent Music Entertainment Group Narrative
Earlier we mentioned that there is an even better way to understand valuation. Narratives on Simply Wall St let you attach your own story about Tencent Music Entertainment Group to the numbers by linking your view of its future revenue, earnings and margins to a financial forecast, a fair value, and then a clear comparison with the current share price. This is all within an easy tool on the Community page that updates automatically when new news or earnings arrive. One investor might back a more optimistic Tencent Music view that lines up with a higher fair value around US$30.26, while another might prefer a cautious stance closer to US$21.77, and each can immediately see how their chosen Narrative lines up against today’s price and what that means for their next move.
Do you think there's more to the story for Tencent Music Entertainment Group? Head over to our Community to see what others are saying!
This article by Simply Wall St is general in nature. We provide commentary based on historical data and analyst forecasts only using an unbiased methodology and our articles are not intended to be financial advice. It does not constitute a recommendation to buy or sell any stock, and does not take account of your objectives, or your financial situation. We aim to bring you long-term focused analysis driven by fundamental data. Note that our analysis may not factor in the latest price-sensitive company announcements or qualitative material. Simply Wall St has no position in any stocks mentioned.
Have feedback on this article? Concerned about the content? Get in touch with us directly. Alternatively, email editorial-team@simplywallst.com