
- LIVE QUOTES
- LEARN
- HELP
 Nasdaq
 Wall Street Journal
EN
Is Ball (BALL) Pricing Catching Up After Packaging Refocus And Mixed Long Term Returns
- If you are wondering whether Ball's current share price really reflects what the business is worth, this article walks through the key valuation angles to help you frame that question clearly.
- Over the short term, Ball's share price has moved by 0.8% over the last week, 20.2% over the last month, 25.1% year to date, with a 37.4% return over 1 year and 21.3% over 3 years, compared with a 21.4% decline over 5 years. Taken together, these figures give a mixed picture of how the market has priced the stock over time.
- Recent coverage has focused on Ball's position in packaging and related markets, as investors reassess how its business profile fits into broader themes such as consumer trends and materials usage. This renewed attention helps explain why the stock's returns over shorter periods differ from its longer term track record.
- On our checklist driven valuation framework, Ball scores 5 out of 6 on undervaluation checks, giving it a valuation score of 5. Next, we will look at how different valuation methods line up on that score before finishing with a more complete way to think about what the market is pricing in.
Approach 1: Ball Discounted Cash Flow (DCF) Analysis
The Discounted Cash Flow, or DCF, approach estimates what a company might be worth by projecting its future cash flows and then discounting those back to today’s value using a required return. It is essentially asking what those future dollars are worth in today's terms.
For Ball, the model used is a 2 Stage Free Cash Flow to Equity approach based on cash flow projections. The latest twelve month free cash flow is about $549.9 million. Analysts have provided forecasts for the next few years, and Simply Wall St then extrapolates those out, with projected free cash flow of $1,498.5 million in 2035, all expressed in $.
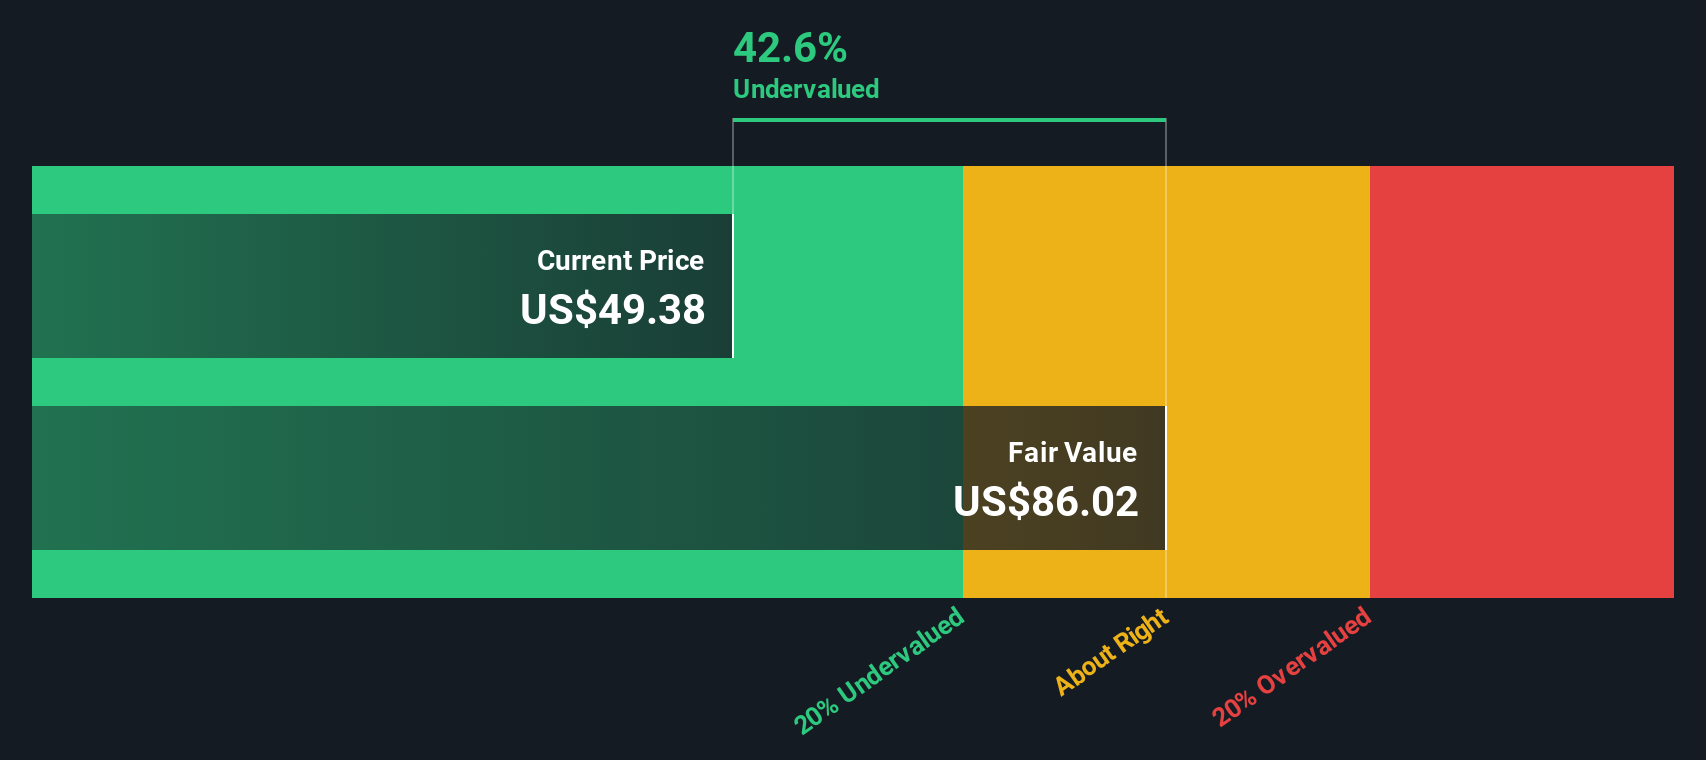
When these projected cash flows are discounted back, the model arrives at an estimated intrinsic value of $101.34 per share. Compared with the current share price, this implies a 34.2% discount. This indicates that the shares are priced below this DCF estimate.
Result: UNDERVALUED
Our Discounted Cash Flow (DCF) analysis suggests Ball is undervalued by 34.2%. Track this in your watchlist or portfolio, or discover 55 more high quality undervalued stocks.
Approach 2: Ball Price vs Earnings
For profitable companies, the P/E ratio is a straightforward way to see how much investors are paying for each dollar of earnings. It ties the share price directly to the bottom line, which is usually the key driver of long term value.
What counts as a "normal" or "fair" P/E depends on how the market views a company’s growth prospects and risks. Higher expected growth or lower perceived risk can justify a higher multiple, while slower growth or higher risk usually goes with a lower one.
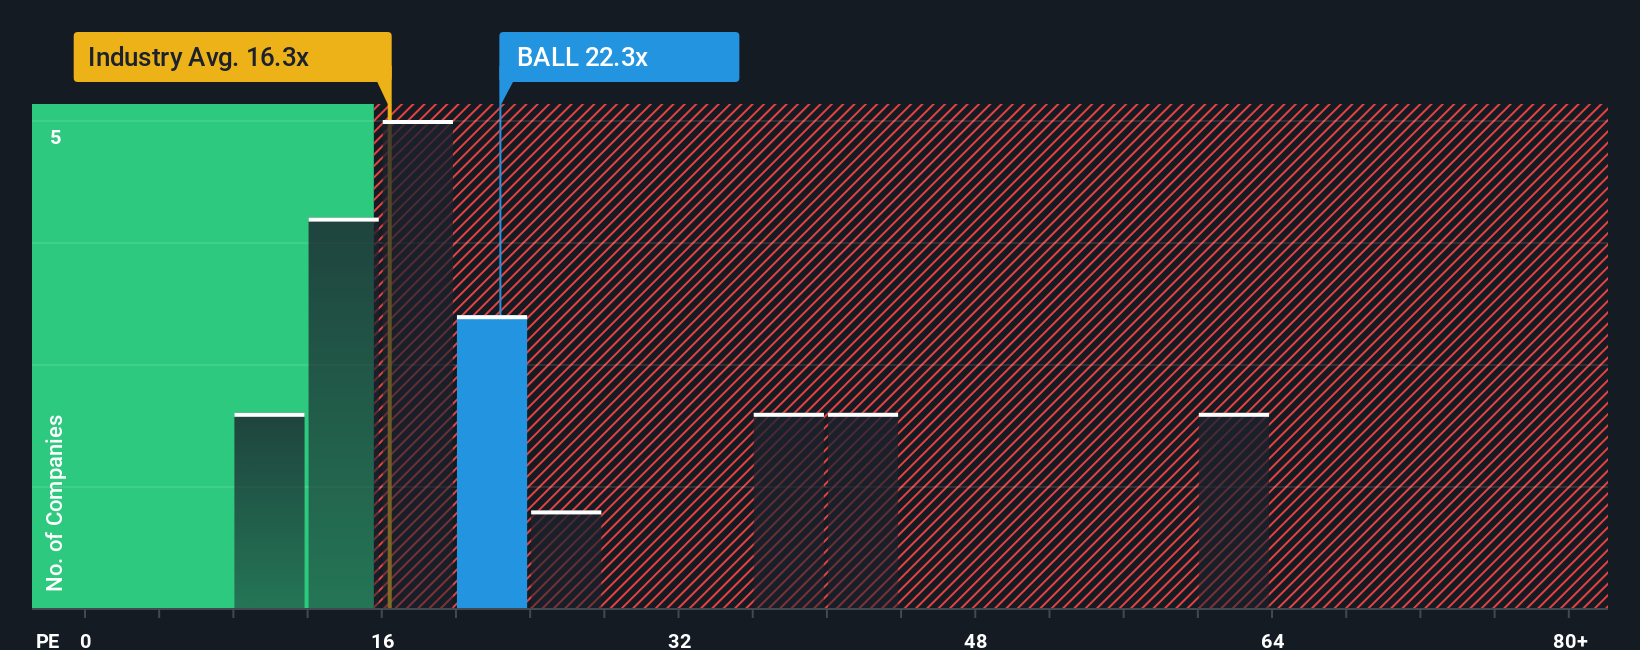
Ball currently trades on a P/E of 19.61x. That sits above the Packaging industry average of 16.28x and slightly below the peer average of 20.24x. Simply Wall St’s Fair Ratio for Ball is 21.70x. This Fair Ratio is a proprietary estimate of what P/E might be reasonable given factors such as earnings growth, industry, profit margins, market cap and specific risks.
Compared with a simple peer or industry comparison, the Fair Ratio offers a more tailored yardstick because it accounts for those company specific drivers. With Ball at 19.61x versus a Fair Ratio of 21.70x, the shares are trading below this Fair Ratio based assessment.
Result: UNDERVALUED
P/E ratios tell one story, but what if the real opportunity lies elsewhere? Start investing in legacies, not executives. Discover our 23 top founder-led companies.
Upgrade Your Decision Making: Choose your Ball Narrative
Earlier we mentioned that there is an even better way to understand valuation. Narratives on Simply Wall St let you tell the story you believe about Ball, link that story to specific assumptions for revenue, earnings, margins and a fair value, and then compare that fair value with the current price. All of this is in a simple tool on the Community page that updates automatically when fresh news or earnings arrive. This is why one investor might back a higher fair value of about US$72.00 while another leans toward roughly US$51.87, even though both are looking at the same company and the same share price.
For Ball however we will make it really easy for you with previews of two leading Ball Narratives:
Fair value in this bullish narrative: US$72.00 per share
Current price vs that fair value, on this view the stock screens as about 7.3% undervalued using ((72.00 minus 66.72) divided by 72.00).
Revenue growth assumption in this narrative: 4.97% a year
- Backers of this view focus on a long runway for aluminum packaging as brands and regulators favor recyclable materials, with Ball’s expanded can making capacity aimed at capturing that demand.
- They also note the sharpened focus on packaging after exiting aerospace, with cash redirected to buybacks and new lines that are expected to support earnings and free cash flow over time.
- Key watchpoints include possible competition from other sustainable materials, slower beverage volume growth, and the risk that new plants do not run at high enough utilization to justify the heavy investment.
Fair value in this more cautious narrative: US$62.69 per share
Current price vs that fair value, on this view the stock screens as about 6.4% overvalued using ((66.72 minus 62.69) divided by 62.69).
Revenue growth assumption in this narrative: 4.24% a year
- Supporters of this stance still see steady demand for recyclable cans and ready to drink beverages, but think current expectations already reflect that, so they anchor on a more moderate upside case.
- They highlight the benefits of long term contracts, tighter supply and a focus on core packaging, which together offer clearer visibility on earnings but also limit room for positive surprise if conditions stay similar.
- On the risk side, they pay close attention to dependence on a few large customers, input cost swings, mix shifting to potentially lower margin formats, and tighter sustainability rules that could weigh on profitability.
Whichever side feels closer to your own view, the important step is to pressure test these assumptions against what you believe about Ball’s end markets, cost base and balance of risks over the next few years, then decide which narrative you find more reasonable.
Curious how numbers become stories that shape markets? Explore Community Narratives
Do you think there's more to the story for Ball? Head over to our Community to see what others are saying!

This article by Simply Wall St is general in nature. We provide commentary based on historical data and analyst forecasts only using an unbiased methodology and our articles are not intended to be financial advice. It does not constitute a recommendation to buy or sell any stock, and does not take account of your objectives, or your financial situation. We aim to bring you long-term focused analysis driven by fundamental data. Note that our analysis may not factor in the latest price-sensitive company announcements or qualitative material. Simply Wall St has no position in any stocks mentioned.
Have feedback on this article? Concerned about the content? Get in touch with us directly. Alternatively, email editorial-team@simplywallst.com