
- LIVE QUOTES
- LEARN
- HELP
 Nasdaq
 Wall Street Journal
EN
Is The Strong Multi Year Rally In Westinghouse Air Brake Technologies (WAB) Still Justified
- If you are wondering whether Westinghouse Air Brake Technologies is fairly priced at its current level, this article will walk through what the numbers are really saying about the stock.
- The share price recently closed at US$253.79, with returns of 5.7% over 7 days, 11.6% over 30 days, 17.3% year to date, 29.8% over 1 year, 147.2% over 3 years and 261.8% over 5 years. This naturally raises questions about how much of the story is already reflected in the price.
- Recent headlines around Westinghouse Air Brake Technologies have focused on the business and its role in capital goods and transportation equipment, giving investors more information to weigh against the share price. This context matters because it shapes how the market interprets both new data points and longer term themes around the company.
- Our initial valuation work assigns Westinghouse Air Brake Technologies a value score of 0 out of 6. This sets up a closer look at methods like discounted cash flow, multiples and peer comparisons, and leads into a broader way of thinking about valuation that we will come back to at the end of the article.
Westinghouse Air Brake Technologies scores just 0/6 on our valuation checks. See what other red flags we found in the full valuation breakdown.
Approach 1: Westinghouse Air Brake Technologies Discounted Cash Flow (DCF) Analysis
A Discounted Cash Flow, or DCF, model estimates what a business could be worth today by projecting its future cash flows and then discounting those back into present value.
For Westinghouse Air Brake Technologies, the model uses a 2 Stage Free Cash Flow to Equity approach. The latest twelve month free cash flow is about $1.28b. Analyst and extrapolated projections suggest free cash flow of $1.45b in 2026, rising to around $2.20b by 2035, with $1.87b projected for 2028. Simply Wall St only uses analyst inputs where available, with later years extrapolated from those earlier expectations.
When these projected cash flows are discounted back to today and allocated across the share count, the estimated intrinsic value comes out at about $182.93 per share. Compared with the recent share price of $253.79, the DCF implies the stock is about 38.7% overvalued on this set of assumptions.
Result: OVERVALUED
Our Discounted Cash Flow (DCF) analysis suggests Westinghouse Air Brake Technologies may be overvalued by 38.7%. Discover 55 high quality undervalued stocks or create your own screener to find better value opportunities.
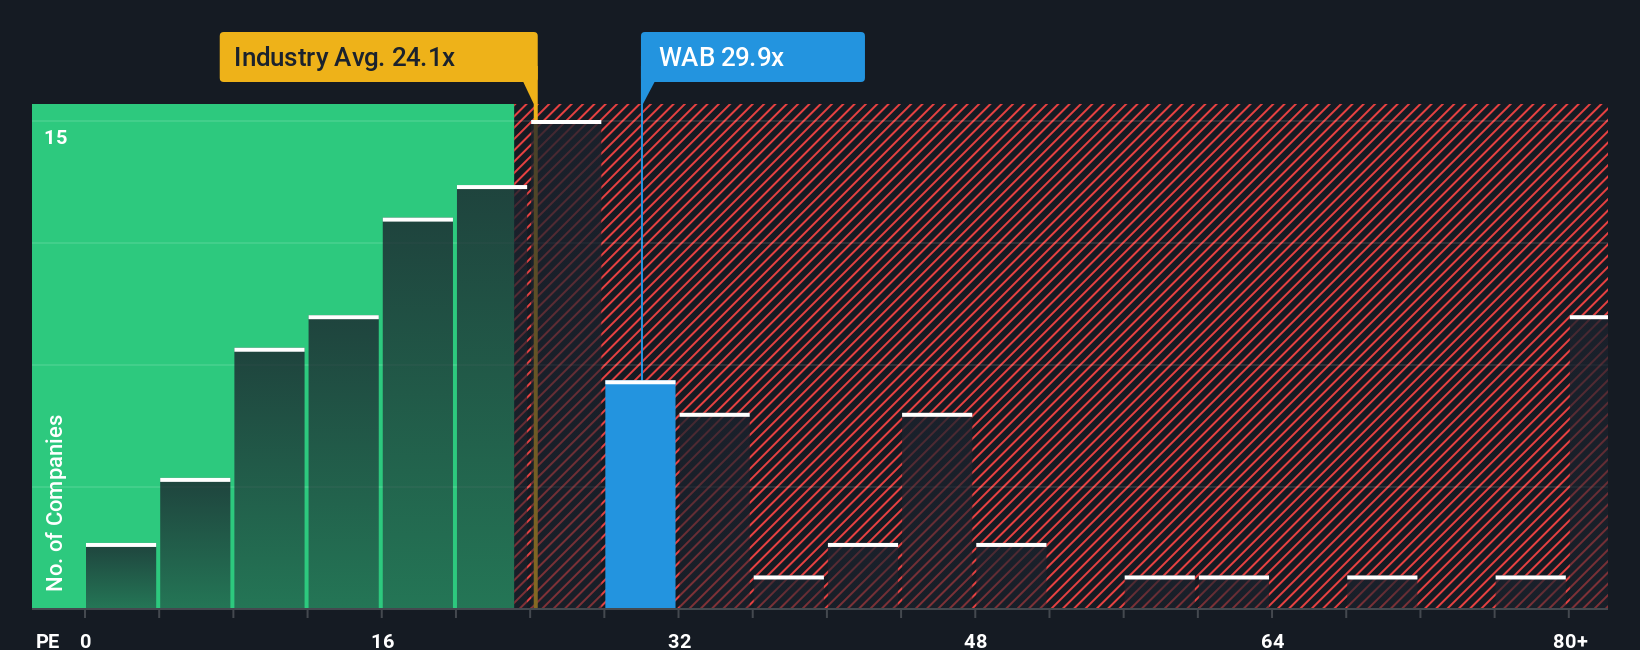
Approach 2: Westinghouse Air Brake Technologies Price vs Earnings
For profitable companies, the P/E ratio is a useful yardstick because it links what you pay for the stock to the earnings the business is currently generating. It also gives you a quick way to compare how the market prices one set of earnings against another.
What counts as a “normal” P/E depends a lot on growth expectations and risk. Higher expected earnings growth or lower perceived risk often justify a higher P/E, while slower growth or higher risk usually align with a lower multiple.
Westinghouse Air Brake Technologies currently trades on a P/E of 36.89x. That sits above the Machinery industry average of 29.89x and above the peer group average of 21.58x. Simply Wall St’s Fair Ratio for the stock is 29.72x. This is a proprietary estimate of what the P/E might be given factors like earnings growth, industry, profit margins, market cap and company specific risks. This Fair Ratio can be more informative than a simple peer or industry comparison because it adjusts for those business characteristics instead of assuming all companies should share the same multiple.
Comparing the Fair Ratio of 29.72x with the actual P/E of 36.89x suggests Westinghouse Air Brake Technologies trades at a richer multiple than those fundamentals indicate.
Result: OVERVALUED
P/E ratios tell one story, but what if the real opportunity lies elsewhere? Start investing in legacies, not executives. Discover our 23 top founder-led companies.
Upgrade Your Decision Making: Choose your Westinghouse Air Brake Technologies Narrative
Earlier we mentioned that there is an even better way to understand valuation, so let us introduce you to Narratives, which are simply your story about a company linked directly to your own forecasts for revenue, earnings and margins. Those forecasts then flow through to a fair value you can compare with the current share price.
On Simply Wall St’s Community page, millions of investors use Narratives as an easy tool to set their assumptions, see the implied fair value, and then decide whether the gap between fair value and price looks wide enough for them to consider buying or selling. The Narrative automatically updates when new information like earnings, rail contract announcements or analyst price targets is added.
For Westinghouse Air Brake Technologies, one investor might build a Narrative close to the higher analyst price target of US$250.00 because they focus on large CSX, Union Pacific and MTA contracts and a fair value estimate around US$249.42. Another might anchor on the lower US$200.00 target because they give more weight to risks such as softer North American demand, a 29,000 railcar build outlook for 2025 and dependence on acquisitions, and both views are kept current as new data flows into their Narratives.
Do you think there's more to the story for Westinghouse Air Brake Technologies? Head over to our Community to see what others are saying!

This article by Simply Wall St is general in nature. We provide commentary based on historical data and analyst forecasts only using an unbiased methodology and our articles are not intended to be financial advice. It does not constitute a recommendation to buy or sell any stock, and does not take account of your objectives, or your financial situation. We aim to bring you long-term focused analysis driven by fundamental data. Note that our analysis may not factor in the latest price-sensitive company announcements or qualitative material. Simply Wall St has no position in any stocks mentioned.
Have feedback on this article? Concerned about the content? Get in touch with us directly. Alternatively, email editorial-team@simplywallst.com