
- LIVE QUOTES
- LEARN
- HELP
 Nasdaq
 Wall Street Journal
EN
Diebold Nixdorf (DBD) EPS Rebound Tests Bulls’ Margin Recovery Narrative
Diebold Nixdorf (DBD) earnings reset expectations with a sharp swing back into profit
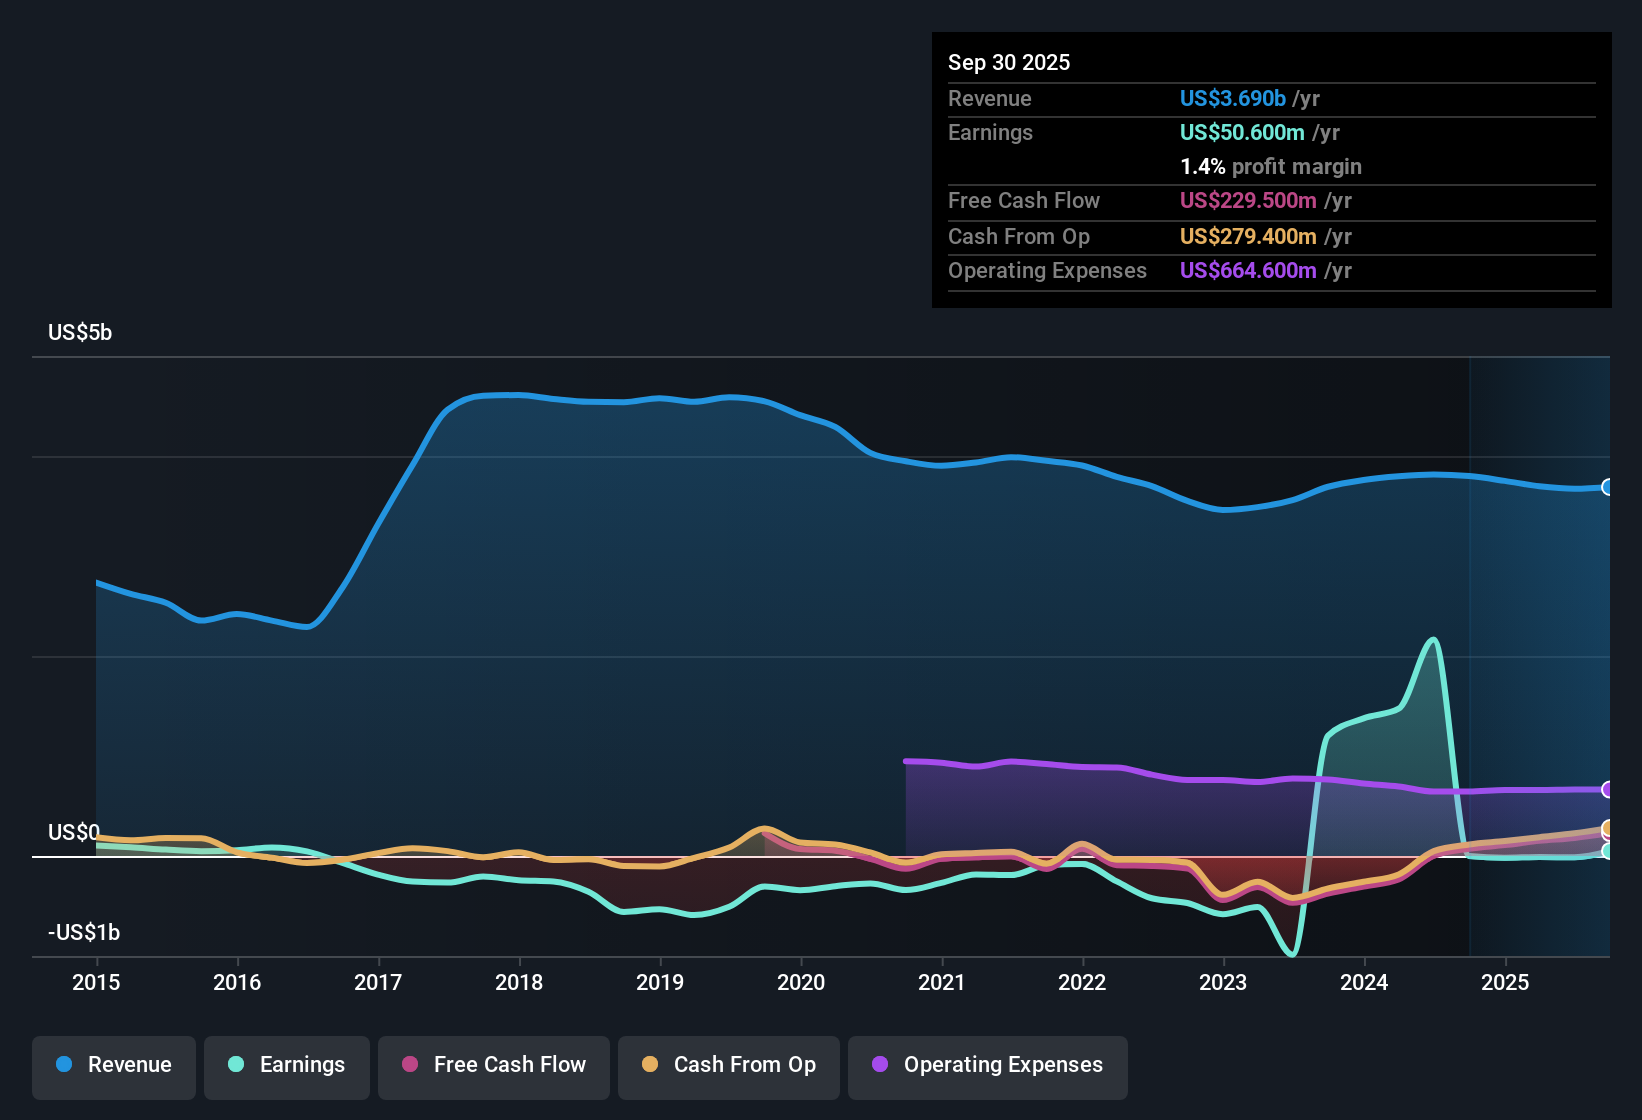
Diebold Nixdorf (DBD) has put a very different set of numbers on the table for FY 2025 so far, with Q3 revenue at US$945.2 million and EPS of US$1.13, alongside trailing 12 month EPS of US$1.36 on US$3.7 billion of revenue. The company has seen quarterly revenue move from US$927.1 million in Q3 2024 to US$945.2 million in Q3 2025, while EPS has shifted from a loss of US$0.60 per share in Q3 2024 to EPS of US$1.13. This sets up a story where investors will be weighing the earnings recovery against how durable these margins really are.
See our full analysis for Diebold Nixdorf.With the latest figures on the table, the next step is to see how these results line up with the prevailing stories around Diebold Nixdorf, and where the numbers start to challenge those narratives.
See what the community is saying about Diebold Nixdorf
EPS swing points to margin repair in 2025
- Across FY 2025 so far, basic EPS moved from a loss of US$0.22 in Q1 to US$0.33 in Q2 and US$1.13 in Q3, while net income went from a loss of US$8.3 million to profits of US$12.2 million and then US$41.1 million over the same stretch.
- Bulls see this kind of EPS turnaround as early proof that margin work is paying off, although the trailing 12 month net profit margin is still only 1.4% and includes a US$69.0 million one off loss, which means:
- The bullish view that margin expansion can support higher earnings has some backing in the shift from losses in early 2025 to US$50.6 million of trailing net income, but the low margin level shows the earnings base is still thin.
- Because part of the recent period is distorted by that one off loss, bulls need to separate recurring profitability from one time items before leaning too heavily on the EPS swing as a steady new baseline.
Bulls argue that this sharp move back into profit could be the start of a longer earnings rebuild story, and they lay out how higher margin software and services might support that view over time. 🐂 Diebold Nixdorf Bull Case
Interest coverage flags a balance sheet risk
- Despite trailing net income of US$50.6 million and a 1.4% net profit margin, the analysis flags that earnings do not comfortably cover interest expense, so interest payments are described as not well covered by current profits.
- Bears focus on this weak interest coverage and high debt history as a core risk, and the recent numbers give them support in a few ways:
- Even with the swing back into profit over the last few quarters, the margin level is low, so any hit to earnings would make it harder to service debt from operations.
- The presence of a US$69.0 million one off loss in the trailing period underlines how sensitive reported earnings can be, which matters a lot when interest costs are described as hard to cover.
Skeptics argue that until earnings clearly cover interest with a wider cushion, debt and financing costs stay front and center in the risk profile. 🐻 Diebold Nixdorf Bear Case
Valuation gap between P/E and DCF fair value
- The shares trade at US$75.59 with a P/E of 53.6x that is roughly in line with peers at 53.7x, while the DCF fair value is given as US$409.84, which is described as about an 81.6% discount to that DCF figure and higher than the Global Tech industry P/E average of 22x.
- Consensus narrative talks about revenue growth and margin improvement over the next few years, and the current mix of valuation signals creates tension with that story:
- The high P/E relative to the wider industry aligns with the idea that the market is already paying up for earnings tied to a turnaround, even though the trailing margin is still just 1.4%.
- At the same time, the large gap between the share price and the DCF fair value puts a lot of weight on long term cash flow assumptions that go well beyond the recent US$3.7b of trailing revenue and US$50.6 million of profit.
Next Steps
To see how these results tie into long-term growth, risks, and valuation, check out the full range of community narratives for Diebold Nixdorf on Simply Wall St. Add the company to your watchlist or portfolio so you'll be alerted when the story evolves.
See the numbers pointing in a different direction, shape that view into your own narrative in just a few minutes and Do it your way
A great starting point for your Diebold Nixdorf research is our analysis highlighting 2 key rewards and 2 important warning signs that could impact your investment decision.
See What Else Is Out There
Diebold Nixdorf's thin 1.4% net margin, weak interest coverage and reliance on one off items highlight how fragile its current earnings profile still looks.
If you want ideas where balance sheets and earnings support each other more comfortably, check out our solid balance sheet and fundamentals stocks screener (45 results) tailored to highlight companies with stronger financial footing today.
This article by Simply Wall St is general in nature. We provide commentary based on historical data and analyst forecasts only using an unbiased methodology and our articles are not intended to be financial advice. It does not constitute a recommendation to buy or sell any stock, and does not take account of your objectives, or your financial situation. We aim to bring you long-term focused analysis driven by fundamental data. Note that our analysis may not factor in the latest price-sensitive company announcements or qualitative material. Simply Wall St has no position in any stocks mentioned.
Have feedback on this article? Concerned about the content? Get in touch with us directly. Alternatively, email editorial-team@simplywallst.com