
- LIVE QUOTES
- LEARN
- HELP
 Nasdaq
 Wall Street Journal
EN
Is Columbia Sportswear (COLM) Fairly Priced After Recent Rebound In Share Price?
- If you are wondering whether Columbia Sportswear is attractively priced or just a value trap, looking closely at its current valuation is a useful next step.
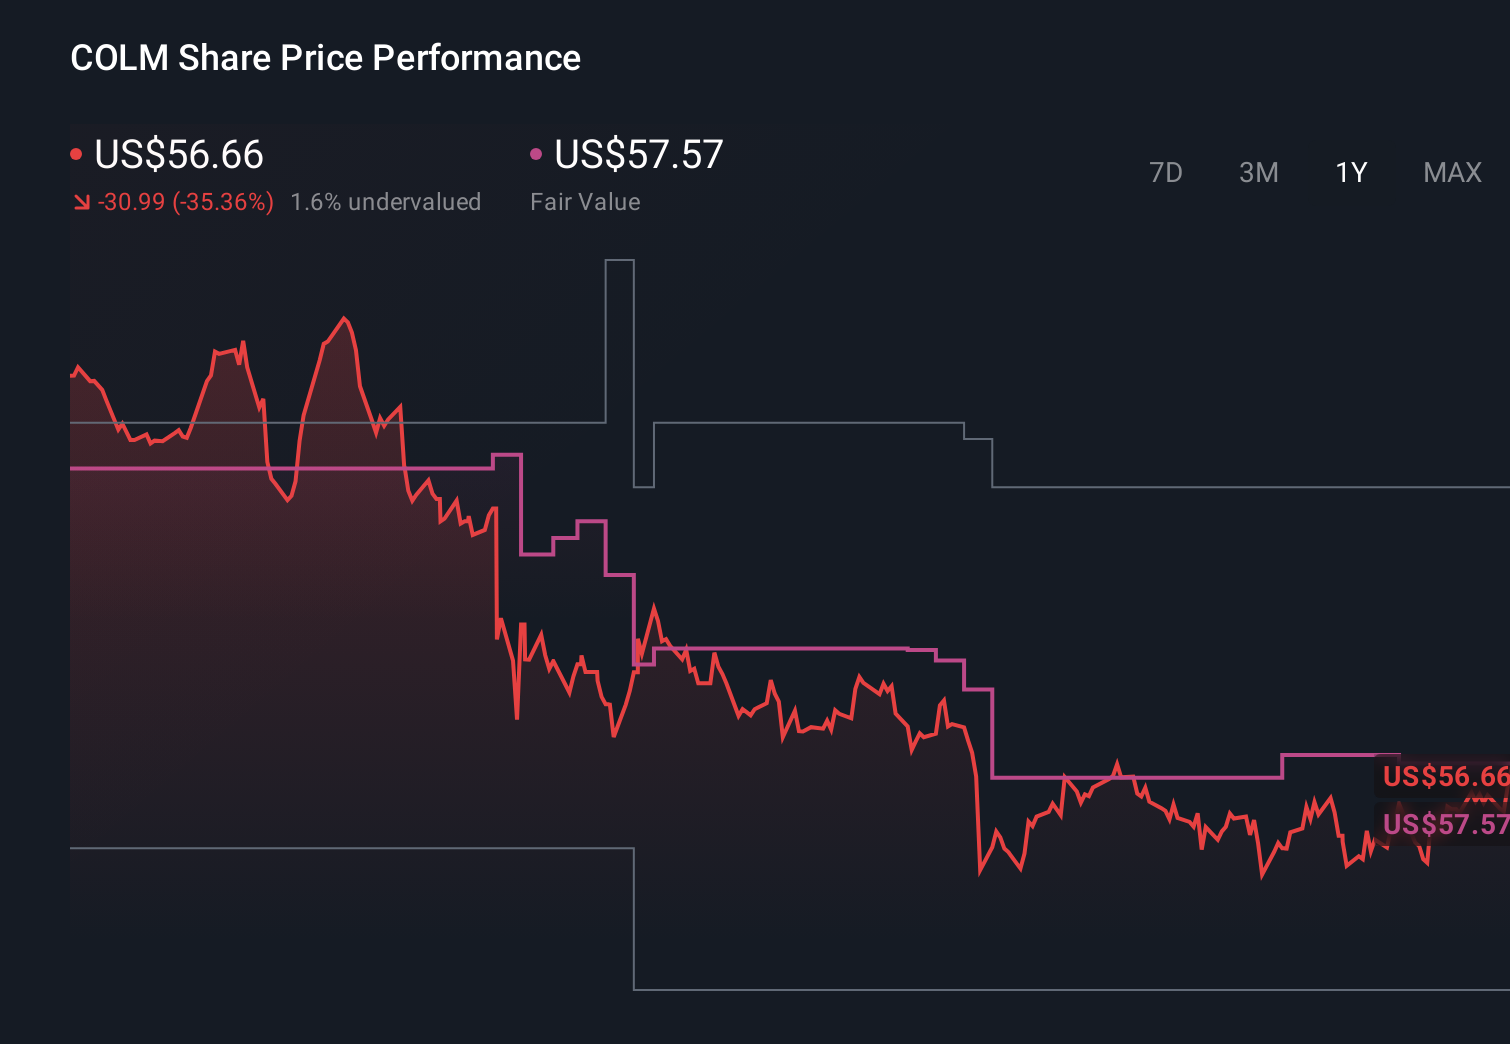
- The stock last closed at US$61.88, with returns of 1.3% over 7 days and 11.8% over 30 days, although the 1 year return of negative 23.6% and 5 year return of negative 35.1% show a very different picture.
- Recent attention on Columbia Sportswear has been shaped by ongoing discussions around brand strength, inventory trends and consumer demand for outdoor apparel, as investors reassess what they are willing to pay for the business. These themes help frame whether the recent 10.4% year to date return and longer term declines reflect changing expectations about its long term earnings power or simply short term sentiment shifts.
- On Simply Wall St's valuation checks, Columbia Sportswear scores 2 out of 6. This suggests that some metrics indicate potential undervaluation while others do not. Next we will walk through different valuation approaches and then finish with a framework that can help you make better sense of what the current price might imply.
Columbia Sportswear scores just 2/6 on our valuation checks. See what other red flags we found in the full valuation breakdown.
Approach 1: Columbia Sportswear Discounted Cash Flow (DCF) Analysis
A Discounted Cash Flow, or DCF, model takes the cash Columbia Sportswear is expected to generate in the future and discounts those projections back to today to estimate what the business might be worth now.
Columbia Sportswear’s latest twelve month free cash flow is about US$223.1 million. Using a 2 Stage Free Cash Flow to Equity model, analysts and extrapolated estimates project annual free cash flow between roughly US$241.0 million in 2026 and US$250.8 million in 2035, with interim years such as 2028 at US$234.2 million. Simply Wall St discounts each of these projected cash flows back to today using its own assumptions to arrive at a single present value figure.
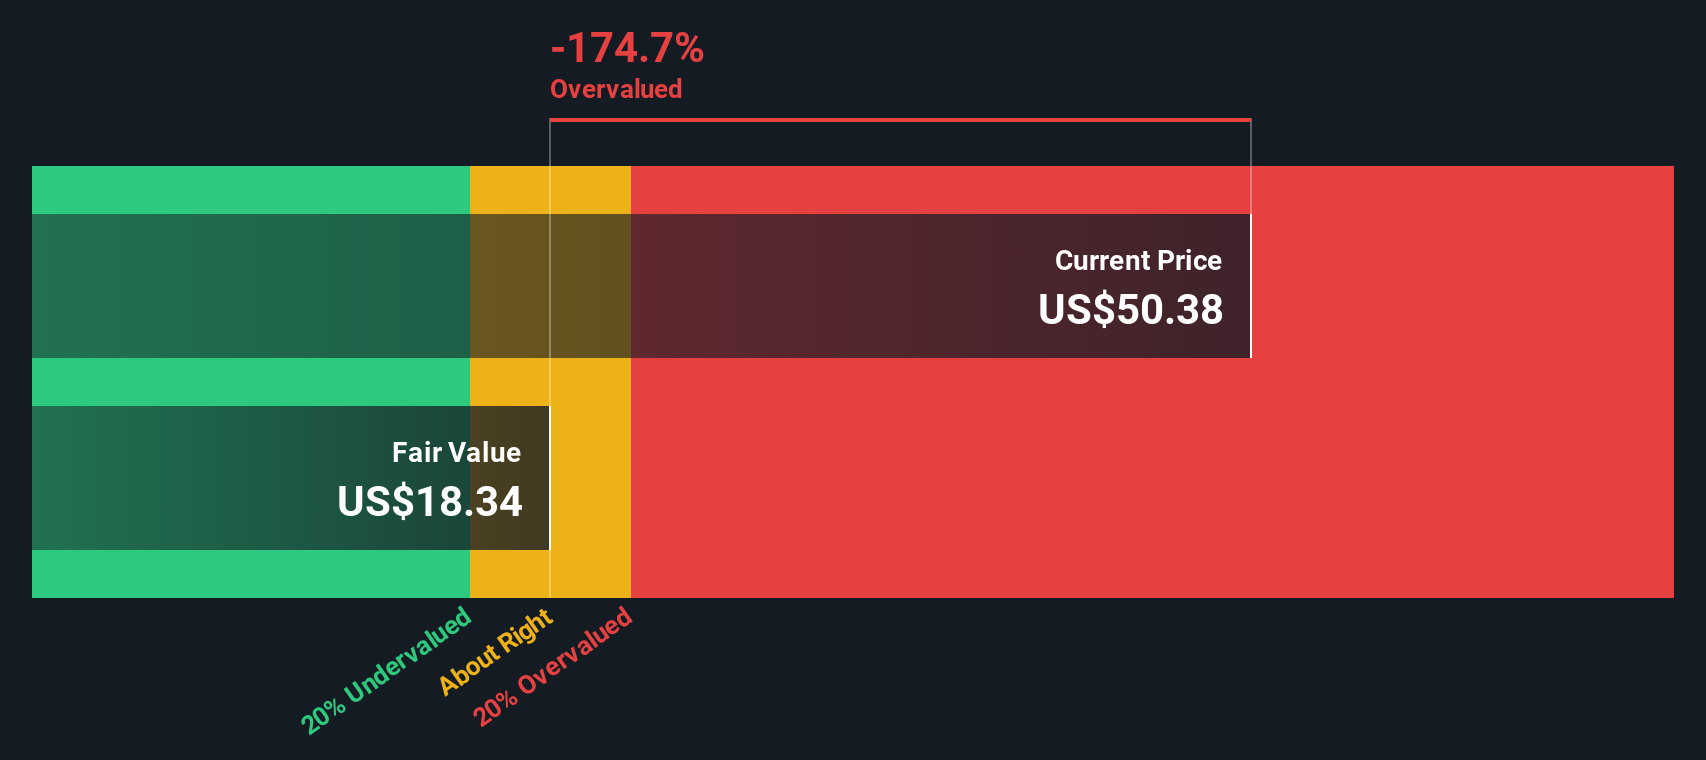
On this basis, the DCF model produces an estimated intrinsic value of about US$61.84 per share. Compared to the recent share price of US$61.88, that implies the stock is around 0.1% overvalued, which is effectively a match within normal modelling noise.
Result: ABOUT RIGHT
Columbia Sportswear is fairly valued according to our Discounted Cash Flow (DCF), but this can change at a moment's notice. Track the value in your watchlist or portfolio and be alerted on when to act.
Approach 2: Columbia Sportswear Price vs Earnings
For profitable companies, the P/E ratio is a useful way to think about what you are paying for each dollar of earnings. It ties directly to the business’s bottom line, which is usually what ultimately supports a share price over time.
What counts as a “normal” P/E depends on what investors expect for future growth and how much risk they see in those earnings. Higher expected growth or lower perceived risk can justify a higher multiple, while slower growth or higher uncertainty often point to a lower one.
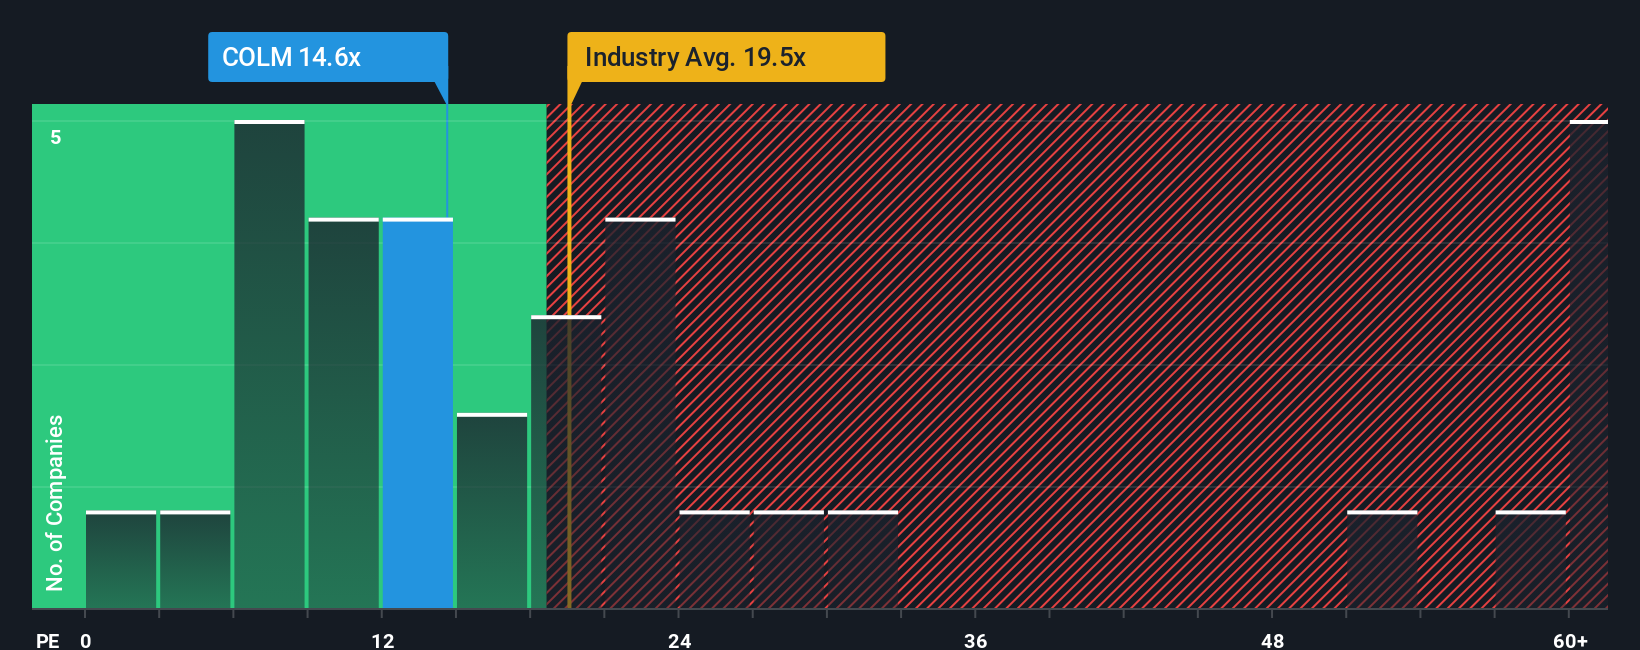
Columbia Sportswear currently trades on a P/E of 18.82x. That sits close to the Luxury industry average of about 18.91x and well below the peer group average of 36.56x. Simply Wall St also calculates a proprietary Fair Ratio of 14.34x, which is the P/E it would expect given factors such as Columbia’s earnings profile, industry, profit margins, market cap and company specific risks.
The Fair Ratio is designed to be more tailored than a simple peer or industry comparison because it adjusts for those underlying fundamentals rather than just lining the stock up beside others. Comparing the current 18.82x to the Fair Ratio of 14.34x suggests the shares are trading above what this framework would view as a more neutral level.
Result: OVERVALUED
P/E ratios tell one story, but what if the real opportunity lies elsewhere? Start investing in legacies, not executives. Discover our 23 top founder-led companies.
Upgrade Your Decision Making: Choose your Columbia Sportswear Narrative
Earlier we mentioned that there is an even better way to understand valuation, so let us introduce you to Narratives, which are simple stories you build around Columbia Sportswear that tie your view on its brand, revenue, earnings and margins to a financial forecast and a fair value. All of this happens within the Simply Wall St Community page used by millions of investors. You can see, for example, one Narrative that treats US$79.0 as fair value based on expectations for US$3.8b of revenue, US$224.3 million of earnings and a 22.1x future P/E, next to another that treats US$40.0 as fair value based on US$3.5b of revenue, US$156.1 million of earnings and a 14.7x future P/E. You can then compare each Narrative’s fair value to today’s share price to decide whether the stock looks expensive or cheap under that story. The tool automatically updates your Narrative when new news, guidance or earnings are added so your decision making stays aligned with the latest information.
For Columbia Sportswear, we will make it really easy for you with previews of two leading Columbia Sportswear Narratives:
Each Narrative takes the same business and current share price and builds a different story around revenue, margins and the P/E investors might be willing to pay. Seeing both side by side can help you decide which assumptions feel closer to your own view.
🐂 Columbia Sportswear Bull Case
Fair value in this Narrative: US$75.00 per share
Gap to this fair value: 17.5% below the Narrative fair value at the recent price of US$61.88
Assumed annual revenue growth: 3.39%
- Assumes low single digit revenue growth with profit margins around the mid single digit range, supported by cost savings, supply chain work and ongoing brand and product efforts.
- Sees room for a higher future P/E on 2028 earnings if Columbia executes on international expansion, digital initiatives and demand creation while keeping a tight rein on costs.
- Treats US$79.00 as the bullish analyst anchor within a Fair Value of US$75.00, with the gap to today’s price coming from expectations that revenue, earnings mix and buybacks can support a higher valuation over time.
🐻 Columbia Sportswear Bear Case
Fair value in this Narrative: US$39.00 per share
Gap to this fair value: 58.7% above the Narrative fair value at the recent price of US$61.88
Assumed annual revenue growth: 0.09%
- Builds in low revenue growth and a move to lower profit margins as tariffs, higher costs, supply chain issues and price sensitive consumers continue to weigh on earnings.
- Assumes Columbia stays heavily exposed to U.S. weakness and intense competition from digital first brands, limiting how much P/E expansion investors are willing to grant.
- Uses a Fair Value of US$39.00, anchored around a US$40.00 bearish target, with the gap to today’s price coming from concerns that topline pressure and margin risk could hold back any rerating.
If you want to go beyond these snapshots and see how different assumptions about revenue, margins and P/E feed into detailed fair value paths over time, Curious how numbers become stories that shape markets? Explore Community Narratives is a good next step.
Do you think there's more to the story for Columbia Sportswear? Head over to our Community to see what others are saying!
This article by Simply Wall St is general in nature. We provide commentary based on historical data and analyst forecasts only using an unbiased methodology and our articles are not intended to be financial advice. It does not constitute a recommendation to buy or sell any stock, and does not take account of your objectives, or your financial situation. We aim to bring you long-term focused analysis driven by fundamental data. Note that our analysis may not factor in the latest price-sensitive company announcements or qualitative material. Simply Wall St has no position in any stocks mentioned.
Have feedback on this article? Concerned about the content? Get in touch with us directly. Alternatively, email editorial-team@simplywallst.com