
- LIVE QUOTES
- LEARN
- HELP
 Nasdaq
 Wall Street Journal
EN
Zillow Group (ZG) Valuation Check As First Full Year Of Profit Meets Legal And Guidance Headwinds
Zillow Group (ZG) has investors’ attention after reporting its first full year of profit since 2012, paired with double digit revenue growth in key segments. However, higher legal costs and cautious guidance are keeping sentiment restrained.
See our latest analysis for Zillow Group.
Despite the stronger operating results, sentiment has turned sharply, with a 1 day share price return of negative 3.10% and a 30 day share price return of negative 35.55% following cautious guidance, legal cost concerns, a fresh shelf registration, and a new revolving credit facility. Over the past year, total shareholder return of negative 42.04% and a 5 year total shareholder return of negative 76.65% suggest momentum has been fading rather than building.
If Zillow’s pullback has you thinking about where else growth and risk might be priced differently, this could be a good moment to scan 23 top founder-led companies.
With the share price under pressure despite the first full year of profit and mid teens revenue growth, plus the stock trading at a sizeable discount to analyst targets and some intrinsic estimates, you have to ask: is this a reset that creates a buying opportunity, or is the market already factoring in all of Zillow’s future growth?
Most Popular Narrative: 48.9% Undervalued
At $43.70, Zillow Group trades well below the most followed fair value estimate of $85.54, setting up a clear gap between the market price and the narrative’s long term view.
The shift toward integrated, end to end digital transaction ecosystems (like Zillow 360 and Enhanced Markets) is enabling Zillow to capture more ancillary services revenue (mortgages, rentals, software), reducing dependence on advertising and expanding top line growth as well as supporting EBITDA margin expansion through operational efficiencies.
There is a full growth blueprint sitting behind that fair value. It leans on faster revenue expansion, rising margins, and a future earnings multiple that many investors reserve for premium internet platforms. Curious which exact assumptions have to line up for $85.54 to make sense against a $43.70 share price today? The full narrative spells out the numbers that need to fall into place.
Result: Fair Value of $85.54 (UNDERVALUED)
Have a read of the narrative in full and understand what's behind the forecasts.
However, this hinges on several pressure points, including how ongoing litigation and real estate commission changes affect Premier Agent economics, and whether tougher data rules curb how Zillow monetizes its audience.
Find out about the key risks to this Zillow Group narrative.
Another way to look at it: Revenue multiple risk
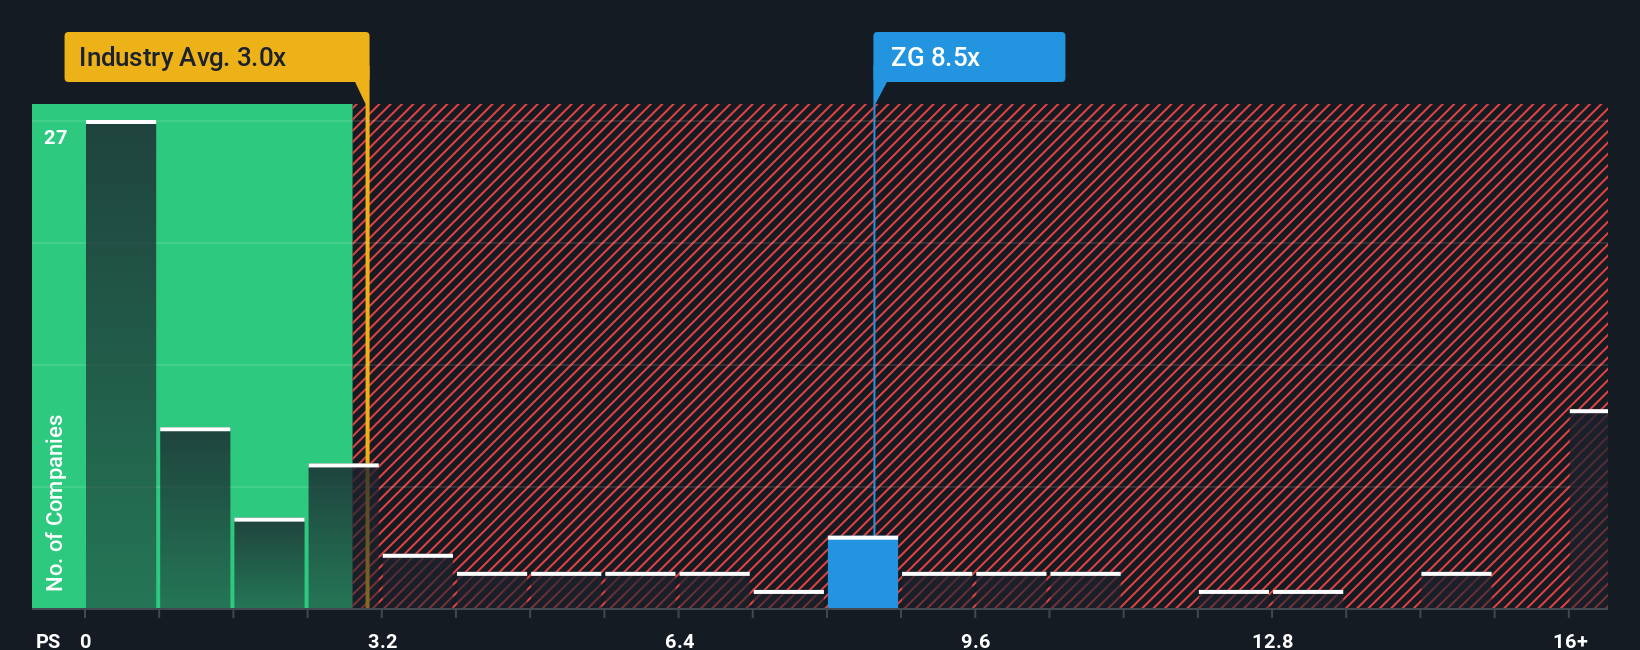
While our DCF model flags Zillow Group as undervalued at $43.70 versus a future cash flow value of $108.08, the current P/S of 4.1x tells a tougher story. It sits above the US Real Estate industry at 2.4x, the peer average at 2.3x, and even the fair ratio of 3.5x. This raises the question of whether the market could still compress this multiple further before any DCF upside really matters.
See what the numbers say about this price — find out in our valuation breakdown.
Build Your Own Zillow Group Narrative
If parts of this story do not quite line up with your own view, or you would rather test the assumptions yourself, you can build a tailored narrative in just a few minutes to match your perspective. To begin, start with Do it your way.
A good starting point is our analysis highlighting 3 key rewards investors are optimistic about regarding Zillow Group.
Looking for more investment ideas?
Once you have formed a view on Zillow, do not stop there. Fresh ideas often come from comparing it with very different businesses across the market.
- Target value by scanning 55 high quality undervalued stocks that pair strong fundamentals with prices that sit below many investors’ expectations.
- Prioritise resilience with 84 resilient stocks with low risk scores that score well on financial health and business stability.
- Spot potential early movers through screener containing 23 high quality undiscovered gems before they show up on everyone else’s radar.
This article by Simply Wall St is general in nature. We provide commentary based on historical data and analyst forecasts only using an unbiased methodology and our articles are not intended to be financial advice. It does not constitute a recommendation to buy or sell any stock, and does not take account of your objectives, or your financial situation. We aim to bring you long-term focused analysis driven by fundamental data. Note that our analysis may not factor in the latest price-sensitive company announcements or qualitative material. Simply Wall St has no position in any stocks mentioned.
Have feedback on this article? Concerned about the content? Get in touch with us directly. Alternatively, email editorial-team@simplywallst.com