
- LIVE QUOTES
- LEARN
- HELP
 Nasdaq
 Wall Street Journal
EN
Is It Too Late To Consider Chubb (CB) After Its Recent 25.8% Share Price Gains?
- If you are wondering whether Chubb's current share price still offers value, looking closely at how the market is pricing the business versus its fundamentals can be a useful next step.
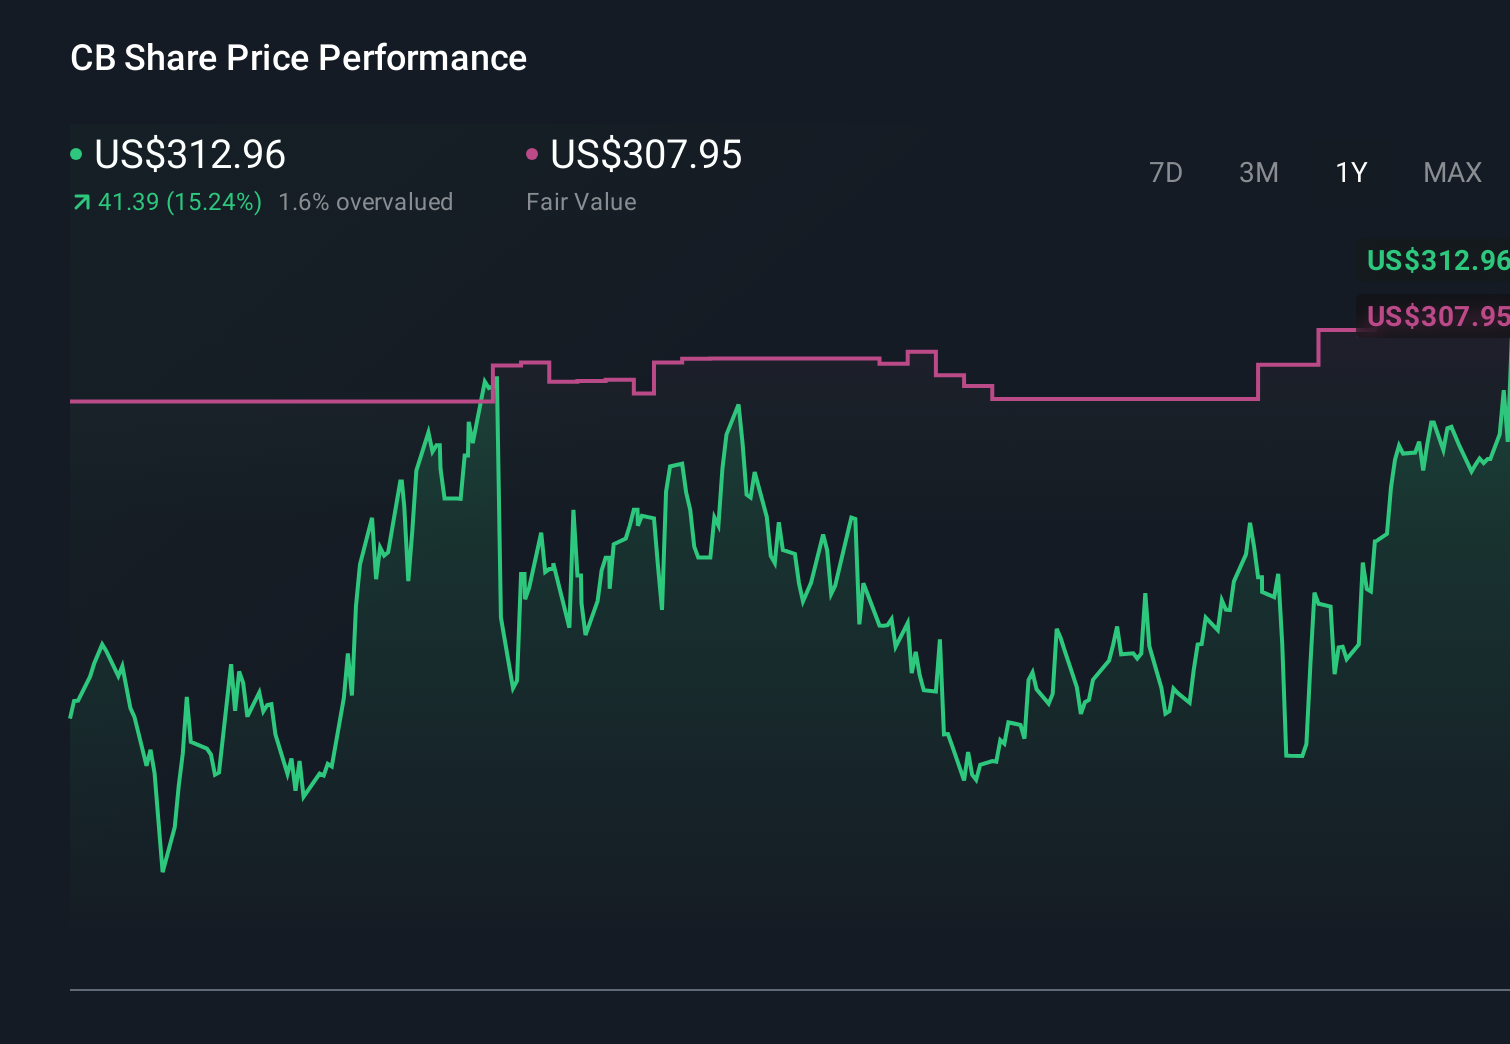
- Chubb shares last closed at US$329.07, with returns of 7.3% over the past 30 days and 25.8% over the past year. This may prompt questions about growth potential and how much risk investors are currently pricing in.
- Recent headlines around Chubb have focused on its position as a major global insurer, its role in providing coverage across property, casualty and specialty lines, and broader discussion about how insurance groups respond to large loss events and changing risk conditions. Together, these themes help frame how investors think about Chubb's earnings resilience, capital strength and pricing power, all of which feed into how the stock is valued.
- On our checklist based valuation framework, Chubb scores 4 out of 6 for being assessed as undervalued. This sets up a closer look at different valuation methods, and later in the article we will also touch on a more complete way to think about what the current price really implies.
Approach 1: Chubb Excess Returns Analysis
The Excess Returns model looks at how much profit Chubb is expected to generate over and above the return that shareholders require, then capitalizes those extra earnings into an intrinsic value per share.
For Chubb, the model uses a Book Value of $188.59 per share and a Stable EPS of $30.45 per share, based on weighted future Return on Equity estimates from 15 analysts. The Average Return on Equity used in the model is 13.30%, while the Cost of Equity is set at $15.56 per share. That leaves an Excess Return of $14.89 per share, which is what the model treats as value created beyond the required shareholder return.
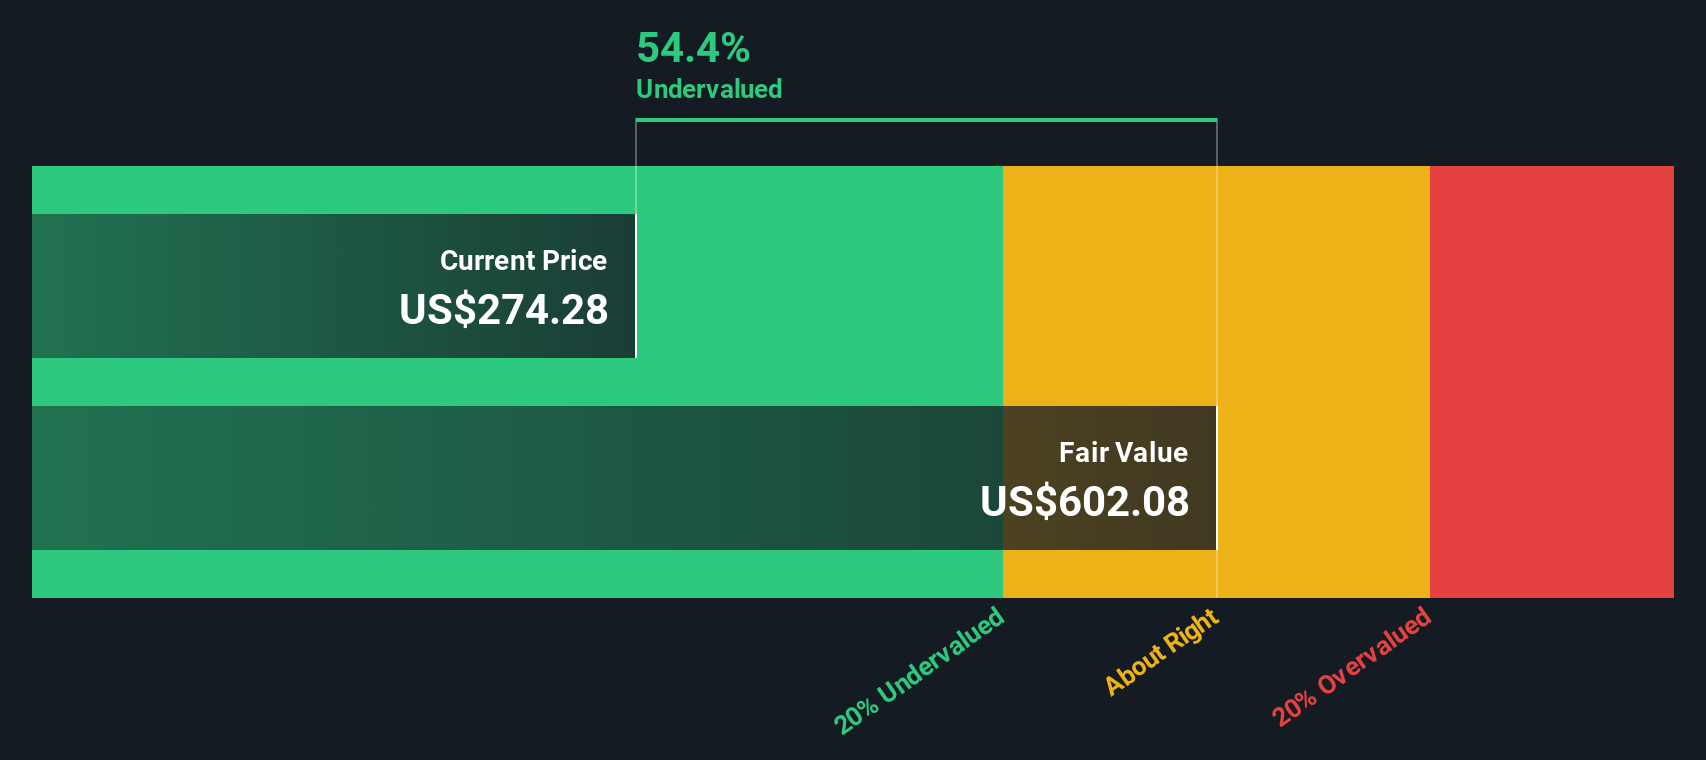
The Stable Book Value input is $228.96 per share, sourced from weighted future Book Value estimates from 13 analysts. Putting these pieces together, the Excess Returns approach produces an estimated intrinsic value of about $669.08 per share. Compared with the recent share price of US$329.07, this implies Chubb trades at roughly a 50.8% discount to this model’s estimate of fair value.
Result: UNDERVALUED
Our Excess Returns analysis suggests Chubb is undervalued by 50.8%. Track this in your watchlist or portfolio, or discover 51 more high quality undervalued stocks.
Approach 2: Chubb Price vs Earnings
For a profitable company like Chubb, the P/E ratio is a straightforward way to see how much investors are currently paying for each dollar of earnings. It ties directly to what matters most to shareholders, the cash the business is generating today.
What counts as a “normal” or “fair” P/E depends on how investors view growth potential and risk. Higher expected earnings growth or lower perceived risk often support a higher multiple, while slower growth or higher risk usually means a lower one.
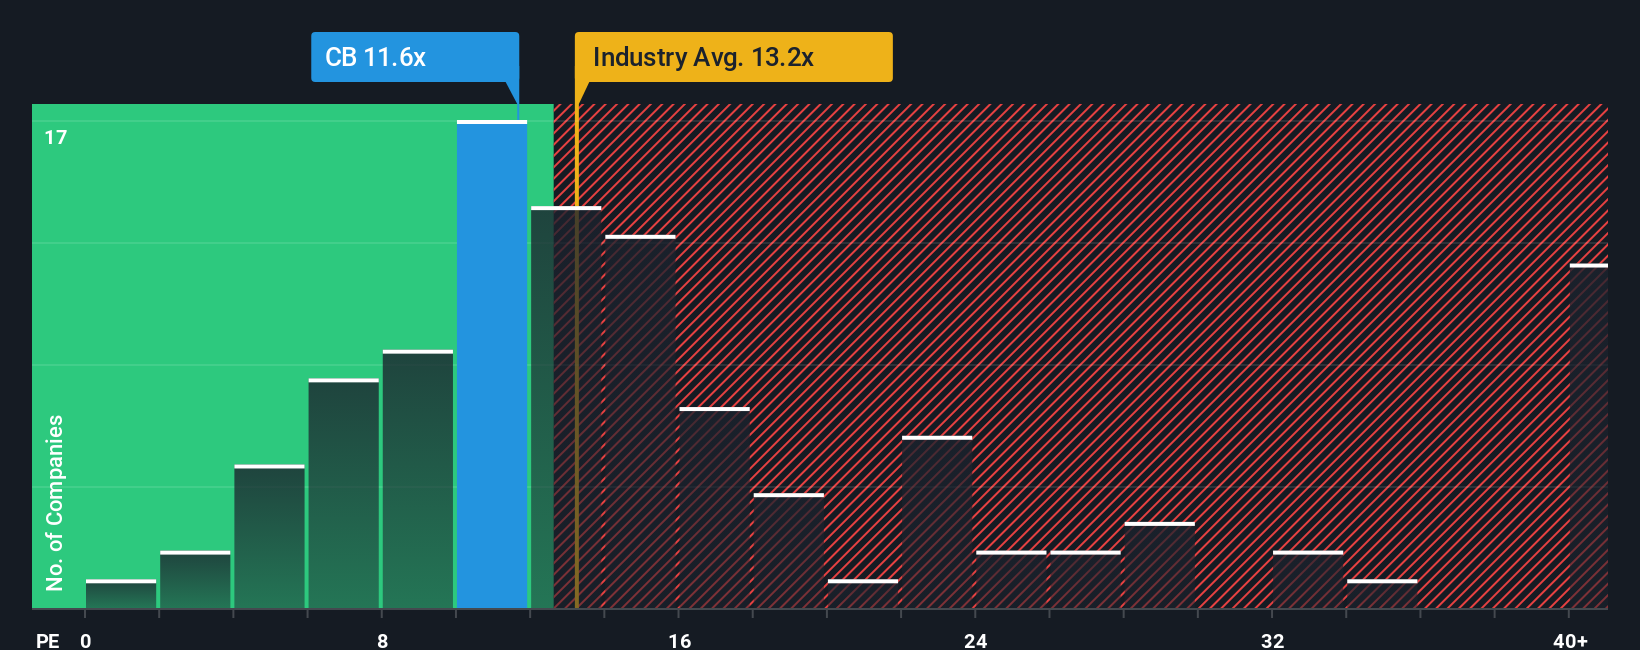
Chubb currently trades on a P/E of 12.48x. This is in line with the Insurance industry average of about 12.48x, but it sits above the peer average of 9.19x, which suggests investors are willing to pay more than for some similar companies. Simply Wall St’s Fair Ratio for Chubb is 13.57x, which is its proprietary view of what a reasonable P/E could be, based on factors like earnings growth, profit margins, industry, market cap and risk profile. Because it adjusts for these company specific drivers, the Fair Ratio can be more informative than a simple comparison with broad industry or peer averages. With the Fair Ratio above the current 12.48x, Chubb screens as undervalued on this metric.
Result: UNDERVALUED
P/E ratios tell one story, but what if the real opportunity lies elsewhere? Start investing in legacies, not executives. Discover our 22 top founder-led companies.
Upgrade Your Decision Making: Choose your Chubb Narrative
Earlier we mentioned that there is an even better way to understand valuation, so let's introduce you to Narratives. These let you turn your view of Chubb into a simple story that links its business outlook to a forecast for revenue, earnings and margins, then to a Fair Value that you can compare with the current price to decide if it looks attractive or stretched. All of this is available within an easy tool on Simply Wall St's Community page that millions of investors use. Narratives update automatically when new information like earnings or buybacks comes through. For example, one investor might build a Chubb Narrative around the higher Fair Value estimate of about US$336.22 with assumptions like a 6.79% discount rate, a 6.92% annual revenue decline, a 23.47% profit margin and a 13.09x future P/E. A more cautious investor could instead lean toward a lower view closer to the US$267 price target. Both can clearly see how their story translates into different Fair Values and decisions.
Do you think there's more to the story for Chubb? Head over to our Community to see what others are saying!
This article by Simply Wall St is general in nature. We provide commentary based on historical data and analyst forecasts only using an unbiased methodology and our articles are not intended to be financial advice. It does not constitute a recommendation to buy or sell any stock, and does not take account of your objectives, or your financial situation. We aim to bring you long-term focused analysis driven by fundamental data. Note that our analysis may not factor in the latest price-sensitive company announcements or qualitative material. Simply Wall St has no position in any stocks mentioned.
Have feedback on this article? Concerned about the content? Get in touch with us directly. Alternatively, email editorial-team@simplywallst.com