
- LIVE QUOTES
- LEARN
- HELP
 Nasdaq
 Wall Street Journal
EN
Is Skyward Specialty Insurance Group (SKWD) Pricing Reflect Its Strong Specialty Insurance Position Today
- If you are wondering whether Skyward Specialty Insurance Group is attractively priced at its current level, this article will walk through what the recent numbers might be telling you about value.
- The share price recently closed at US$46.61, with returns of 6.4% over the last 7 days, 1.1% over the last 30 days, and year to date and 1 year returns of a 4.1% decline and a 4.4% decline, alongside a very large 3 year return of around 2x.
- Recent headlines around Skyward Specialty Insurance Group have focused on its position within the specialty insurance market and how investors are reacting to that story. This helps frame the recent share price moves and gives useful context before you compare the current price with different estimates of value.
- On our valuation checks, Skyward Specialty Insurance Group records a value score of 5 out of 6. Next we will look at what that means across various valuation approaches, then finish with a simple way to bring all those valuation signals together.
Approach 1: Skyward Specialty Insurance Group Excess Returns Analysis
The Excess Returns model looks at how efficiently a company turns its equity base into earnings after covering the shareholders’ required return. In simple terms, it asks whether each dollar of equity is working hard enough to justify the risk.
For Skyward Specialty Insurance Group, book value is estimated at US$23.75 per share, with a stable book value projection of US$30.26 per share, based on future estimates from 7 analysts. Stable EPS is put at US$5.70 per share, sourced from weighted future Return on Equity estimates from 5 analysts, against a cost of equity of US$2.11 per share. That leaves an estimated excess return of US$3.59 per share on an average Return on Equity of 18.83%.
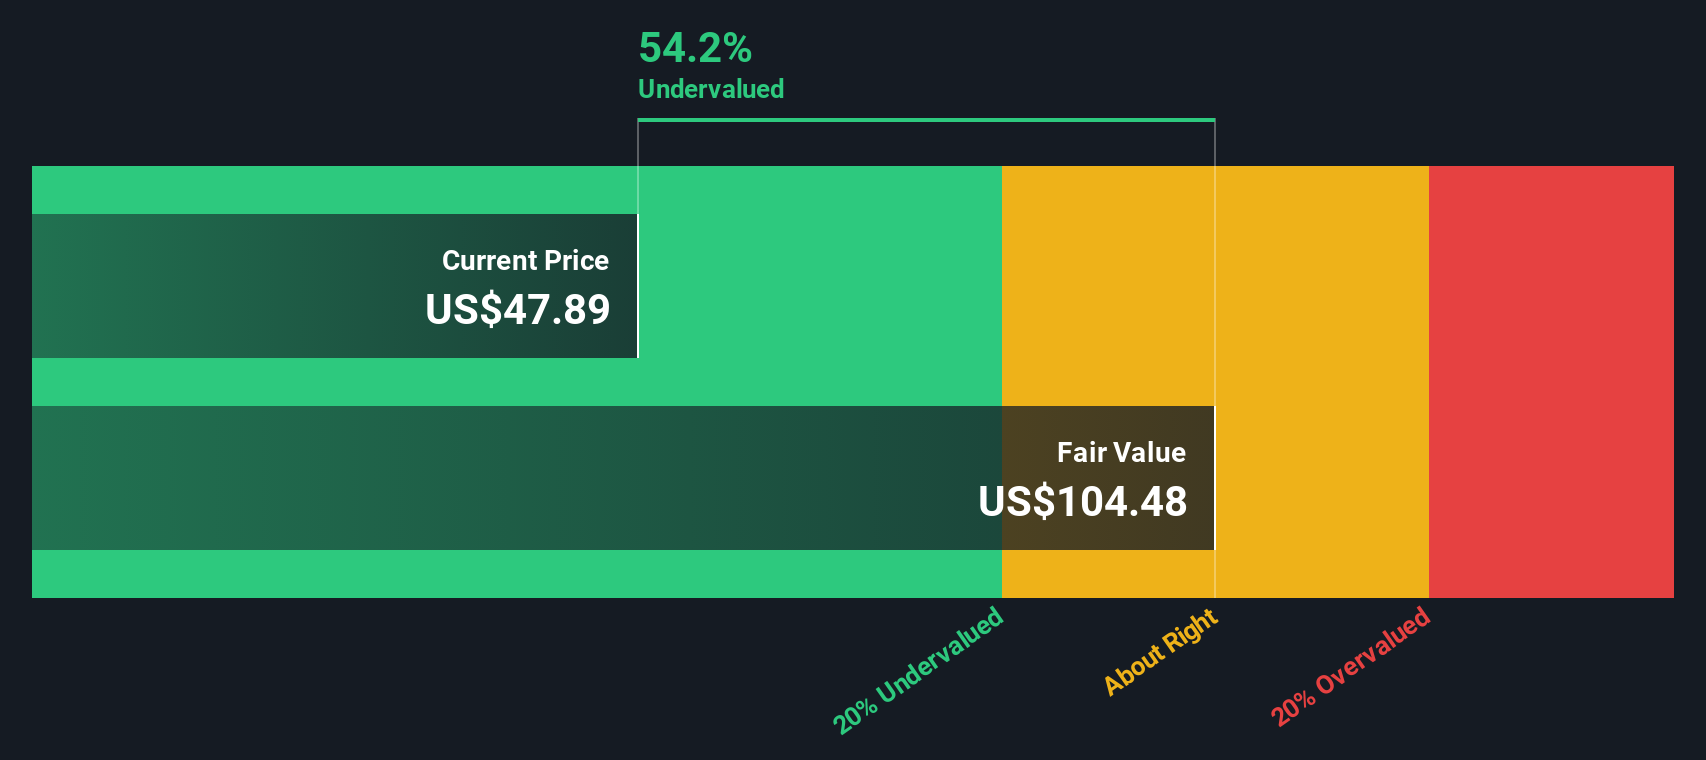
By capitalising these excess returns over time, the model arrives at an intrinsic value of about US$130.75 per share. Compared with the recent share price of US$46.61, the Excess Returns model points to an implied discount of about 64.4%, which indicates the stock screens as significantly undervalued on this basis.
Result: UNDERVALUED
Our Excess Returns analysis suggests Skyward Specialty Insurance Group is undervalued by 64.4%. Track this in your watchlist or portfolio, or discover 51 more high quality undervalued stocks.
Approach 2: Skyward Specialty Insurance Group Price vs Earnings
For a profitable company like Skyward Specialty Insurance Group, the P/E ratio is a useful way to think about value because it links what you pay directly to the earnings the business is already generating. Investors usually accept a higher or lower P/E depending on what they expect for future growth and how risky they think those earnings are.
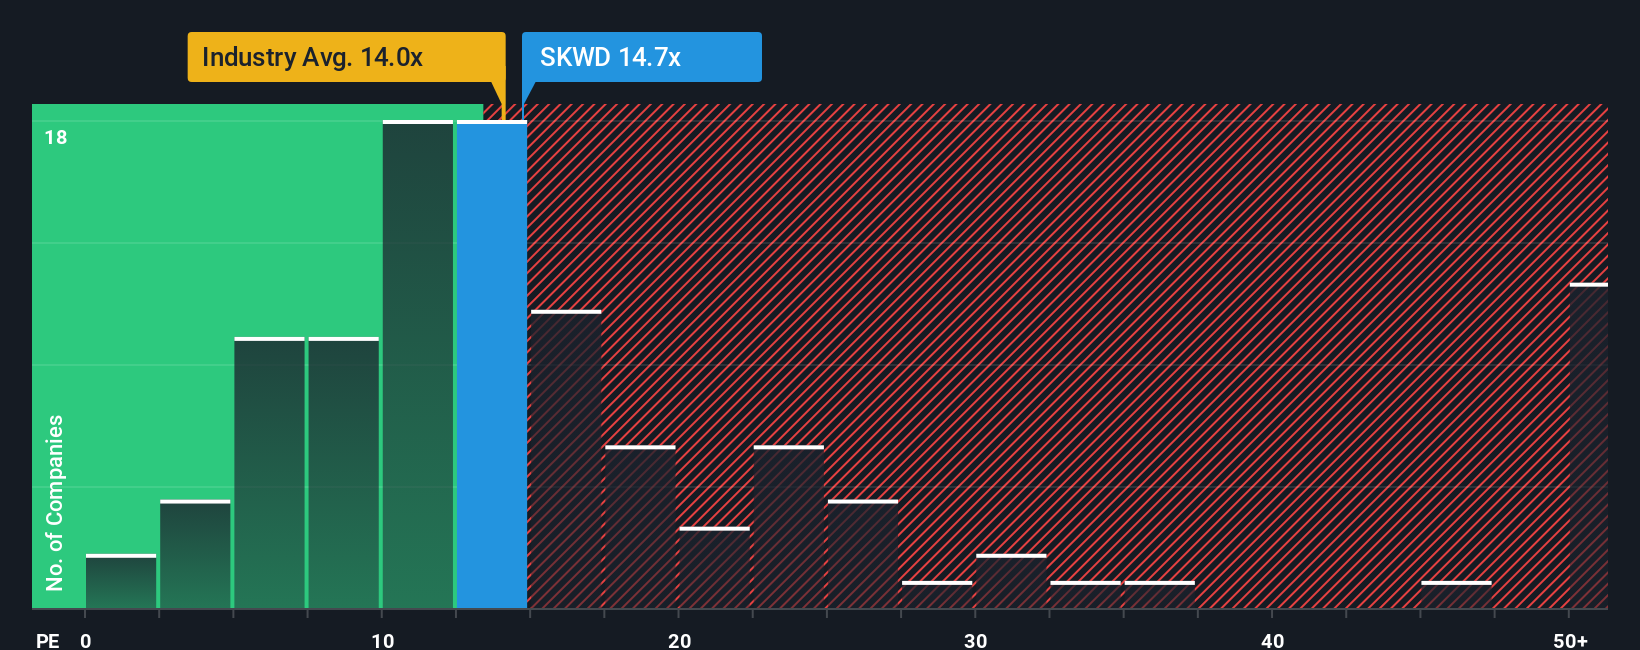
Skyward Specialty Insurance Group is trading on a P/E of 14.58x. That sits above the Insurance industry average of 12.48x, but below the peer group average of 28.51x. To go a step further, Simply Wall St calculates a proprietary “Fair Ratio” of 16.96x, which is the P/E level that might be expected given the company’s earnings growth profile, margins, risks, size and industry.
This Fair Ratio aims to be more tailored than a simple comparison with industry or peers because it adjusts for company specific factors such as growth, risk and profitability rather than assuming all insurers deserve the same multiple. Set against the current P/E of 14.58x, the Fair Ratio of 16.96x suggests the shares screen as undervalued on this metric.
Result: UNDERVALUED
P/E ratios tell one story, but what if the real opportunity lies elsewhere? Start investing in legacies, not executives. Discover our 22 top founder-led companies.
Upgrade Your Decision Making: Choose your Skyward Specialty Insurance Group Narrative
Earlier we mentioned that there is an even better way to understand valuation, so let us introduce you to Narratives, which simply means writing the story you believe about Skyward Specialty Insurance Group, linking that story to a forecast for revenue, earnings and margins, and then seeing what fair value drops out of those assumptions.
On Simply Wall St, Narratives live in the Community page and are used by millions of investors as an easy tool to connect a company’s qualitative story with a full financial model so you can compare your fair value estimate with today’s price and decide whether the gap is big enough to act on.
For Skyward Specialty Insurance Group, one Narrative might lean on the more cautious fair value around US$49.00 and a lower future P/E of about 8.48x. Another might lean on the more optimistic fair value around US$70.00 and a higher future P/E of about 15.51x. Both Narratives will automatically update when new news or earnings are added, so your story and valuation stay current without extra work from you.
Do you think there's more to the story for Skyward Specialty Insurance Group? Head over to our Community to see what others are saying!

This article by Simply Wall St is general in nature. We provide commentary based on historical data and analyst forecasts only using an unbiased methodology and our articles are not intended to be financial advice. It does not constitute a recommendation to buy or sell any stock, and does not take account of your objectives, or your financial situation. We aim to bring you long-term focused analysis driven by fundamental data. Note that our analysis may not factor in the latest price-sensitive company announcements or qualitative material. Simply Wall St has no position in any stocks mentioned.
Have feedback on this article? Concerned about the content? Get in touch with us directly. Alternatively, email editorial-team@simplywallst.com