
- LIVE QUOTES
- LEARN
- HELP
 Nasdaq
 Wall Street Journal
EN
Is It Too Late To Consider MYR Group (MYRG) After A 98% One Year Rally?
- Wondering if MYR Group at around US$270.73 is offering good value today, or if the market has already priced in most of the story? This article walks you through that question step by step.
- The share price has recently been active, with returns of 8.8% over 7 days, 19.8% over 30 days, 19.4% year to date and 98.3% over the past year, while the 3 year and 5 year returns sit at 171.4% and 368.6% respectively.
- These moves are drawing more attention to MYR Group, with recent news coverage focusing on its position in the capital goods space and how investors are reacting to the stock's strong multi year performance. That backdrop helps explain why many investors are now asking whether the current price still lines up with underlying business value.
- Simply Wall St's own valuation model currently gives MYR Group a valuation score of 0 out of 6. Next we will look at how different valuation approaches view the stock, and finish by showing you a more complete way to think about what MYR Group might be worth.
MYR Group scores just 0/6 on our valuation checks. See what other red flags we found in the full valuation breakdown.
Approach 1: MYR Group Discounted Cash Flow (DCF) Analysis
A Discounted Cash Flow, or DCF, model estimates what a company might be worth by projecting its future cash flows and discounting them back to today using a required rate of return.
For MYR Group, the model used here is a 2 Stage Free Cash Flow to Equity approach. The company’s latest twelve month Free Cash Flow is about $148.4 million. Analysts provide explicit forecasts for several years, and Simply Wall St then extends those projections further out. By 2030, projected Free Cash Flow is $210 million. Intermediate years, such as 2026 to 2029, range from $126 million to $173 million before discounting.
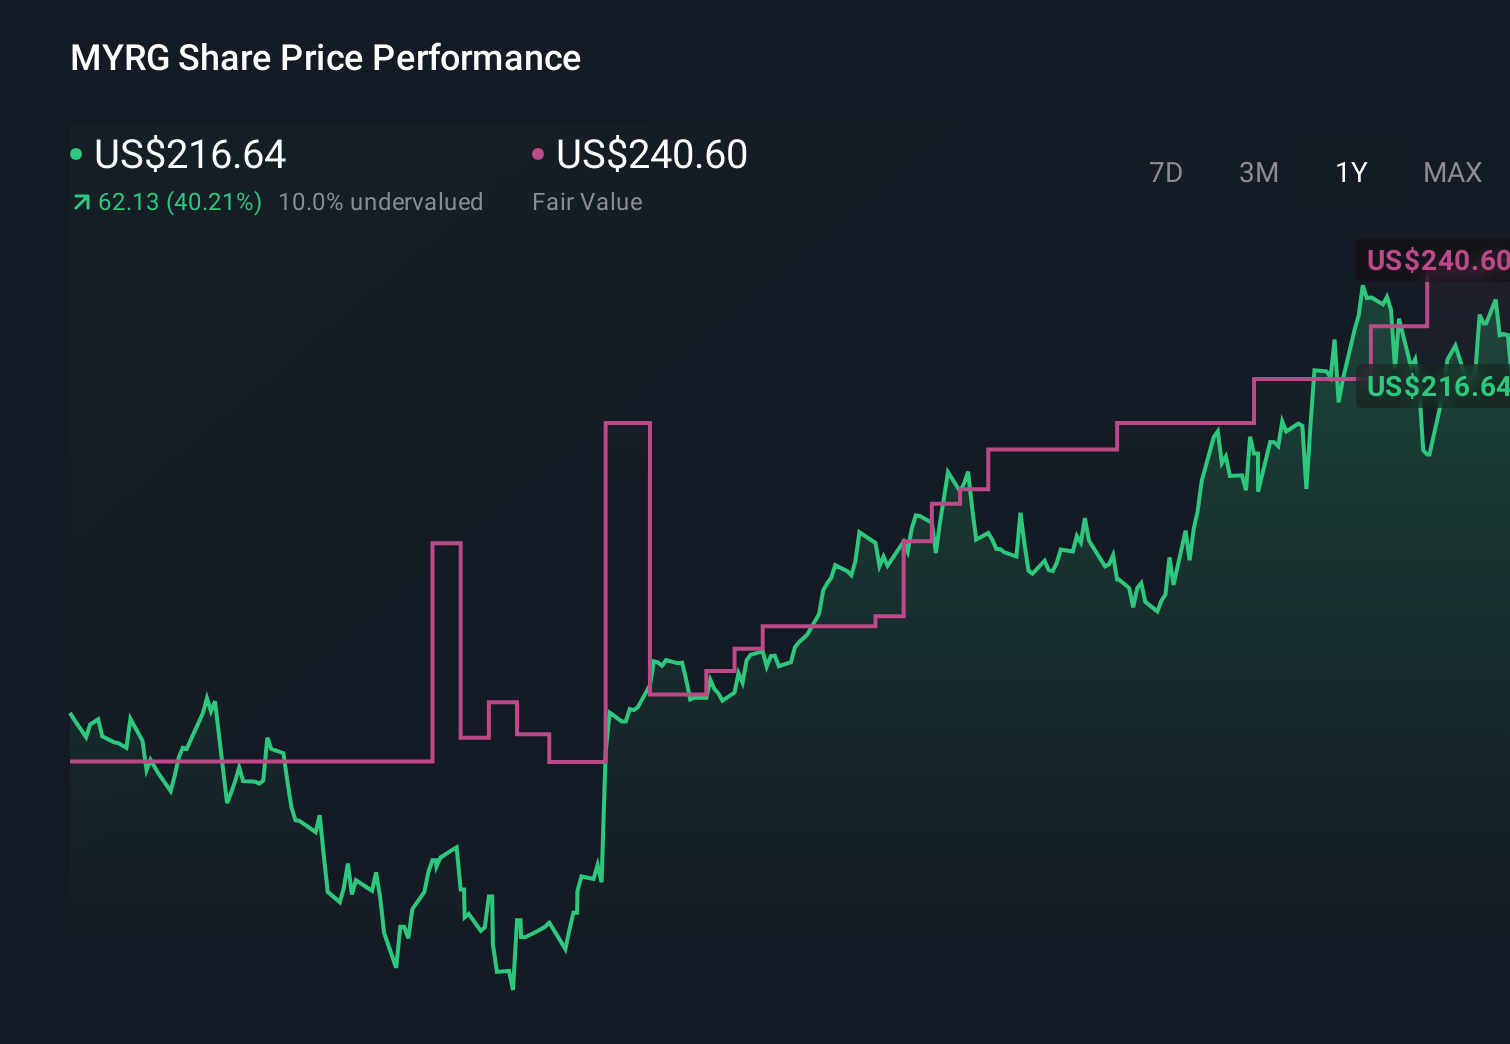
When all those projected cash flows are discounted back to today, the model arrives at an estimated intrinsic value of about $253.64 per share. Compared with a current share price of roughly $270.73, the DCF suggests the stock is about 6.7% overvalued, which is a relatively small gap.
Result: ABOUT RIGHT
MYR Group is fairly valued according to our Discounted Cash Flow (DCF), but this can change at a moment's notice. Track the value in your watchlist or portfolio and be alerted on when to act.

Approach 2: MYR Group Price vs Earnings
For profitable companies like MYR Group, the P/E ratio is a useful shorthand because it connects what you pay today with the earnings the business is already generating. What counts as a “normal” P/E depends on what investors expect for future earnings growth and how much risk they see in those earnings, so there is no single right number for every stock.
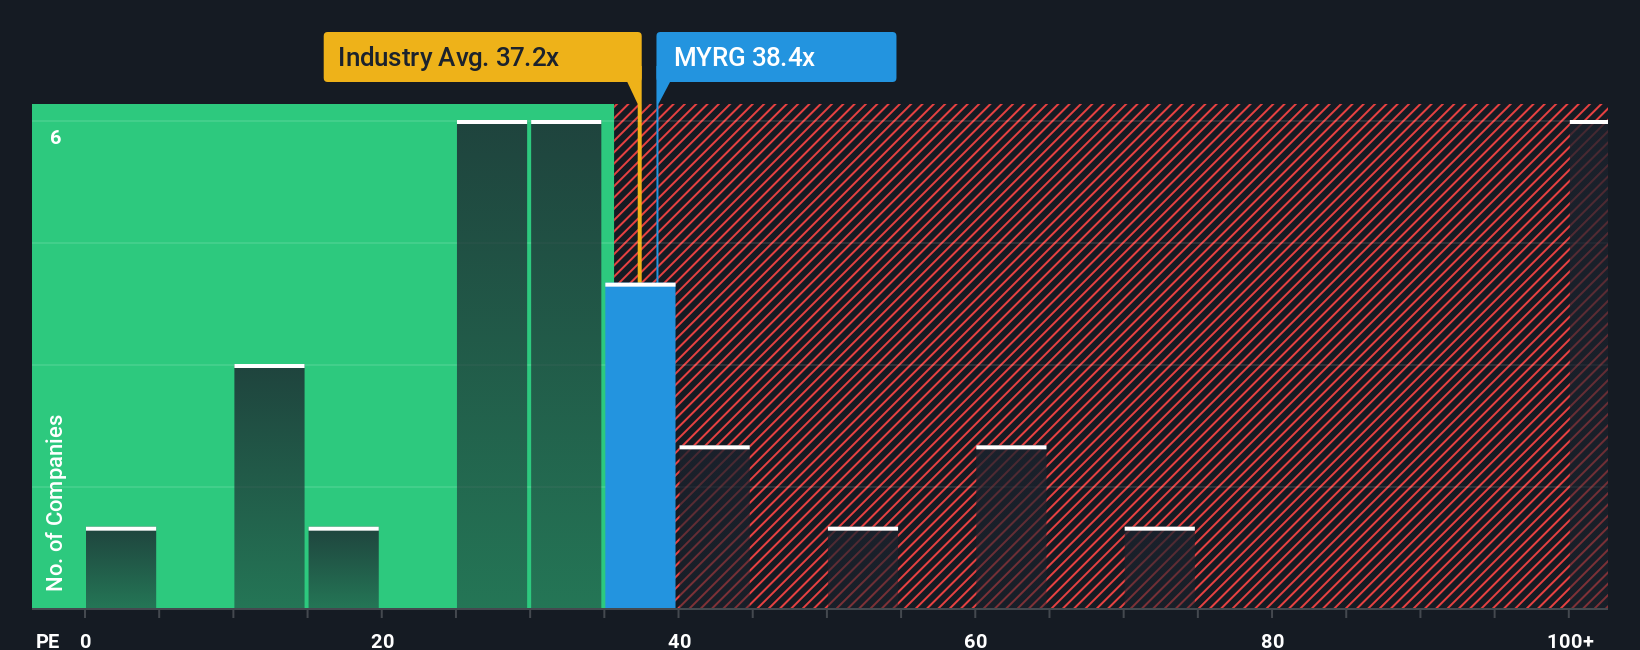
MYR Group currently trades on a P/E of 42.96x. That sits above the peer average of 30.21x and also above the wider Construction industry average of 39.48x. On those simple comparisons, the stock is priced at a higher multiple than many peers.
Simply Wall St’s Fair Ratio for MYR Group is 29.59x. This is a proprietary estimate of what a reasonable P/E could be for the company after factoring in its earnings growth profile, profit margins, risk characteristics, industry and market cap. That makes it more tailored than a basic peer or industry comparison, which could miss company specific strengths or weaknesses. Comparing the Fair Ratio of 29.59x with the current P/E of 42.96x suggests MYR Group is trading above what the model views as a fair earnings multiple.
Result: OVERVALUED
P/E ratios tell one story, but what if the real opportunity lies elsewhere? Start investing in legacies, not executives. Discover our 22 top founder-led companies.
Upgrade Your Decision Making: Choose your MYR Group Narrative
Earlier we mentioned that there is an even better way to think about valuation. On Simply Wall St’s Community page you can use Narratives, where you and other investors connect MYR Group’s story to specific forecasts for revenue, earnings and margins. You can then link those assumptions to a Fair Value, and compare that Fair Value with the current share price to decide whether the stock looks attractive or stretched. Each Narrative updates automatically as new news or earnings arrive. One investor might build a Narrative that leans into grid upgrades and data center demand and lands near the recent analyst Fair Value of about US$254 per share. Another might focus more on solar project risks and arrive at a meaningfully lower fair value. This gives you a clear, side by side view of how different perspectives translate into numbers.
Do you think there's more to the story for MYR Group? Head over to our Community to see what others are saying!
This article by Simply Wall St is general in nature. We provide commentary based on historical data and analyst forecasts only using an unbiased methodology and our articles are not intended to be financial advice. It does not constitute a recommendation to buy or sell any stock, and does not take account of your objectives, or your financial situation. We aim to bring you long-term focused analysis driven by fundamental data. Note that our analysis may not factor in the latest price-sensitive company announcements or qualitative material. Simply Wall St has no position in any stocks mentioned.
Have feedback on this article? Concerned about the content? Get in touch with us directly. Alternatively, email editorial-team@simplywallst.com