
- LIVE QUOTES
- LEARN
- HELP
 Nasdaq
 Wall Street Journal
EN
Is Brixmor Property Group (BRX) Share Price Reflecting Its Recent Gains And Cash Flow Outlook
- If you are wondering whether Brixmor Property Group is reasonably priced at its current level, this article will walk you through what the numbers are really saying about the stock.
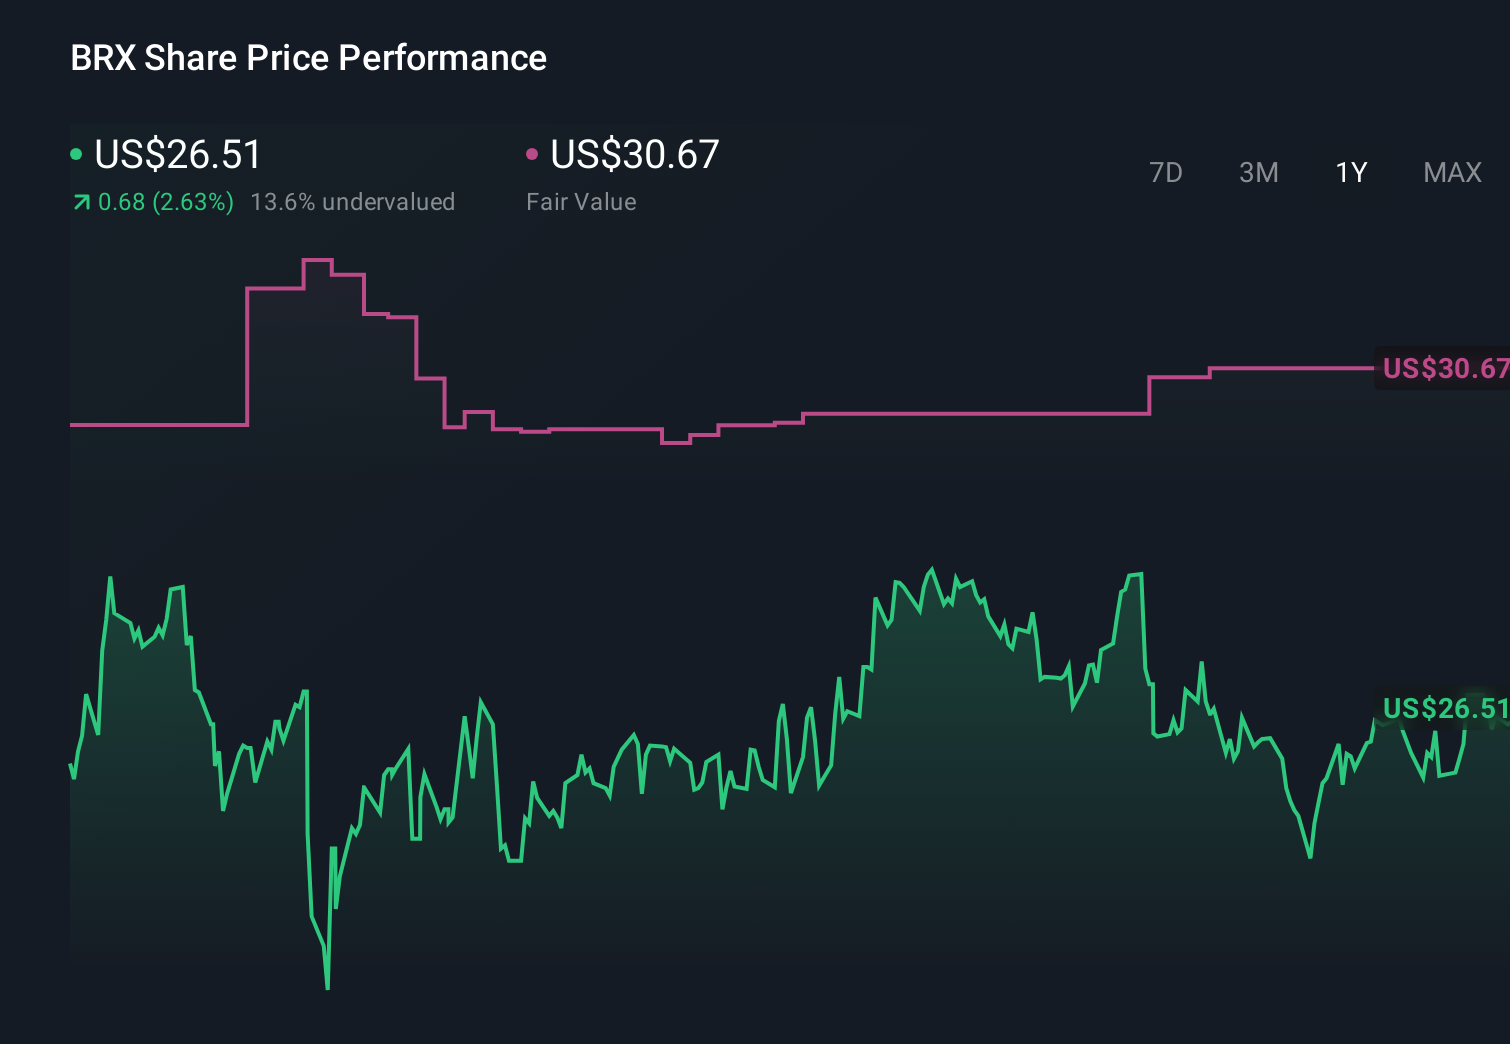
- The shares most recently closed at US$28.53, with returns of 2.9% over 7 days, 11.0% over 30 days, 9.9% year to date, 8.1% over 1 year, 41.9% over 3 years and 84.9% over 5 years.
- Recent coverage has focused on Brixmor as a U.S. shopping center owner and operator, with investors paying close attention to how its portfolio positions it within the listed real estate space. This context is important when thinking about how the current share price lines up against the value of its underlying properties and cash flows.
- On our framework of six valuation checks, Brixmor earns a value score of 4, and next we will look at what different valuation approaches suggest about the stock, while also pointing to a fuller way to think about valuation at the end of the article.
Find out why Brixmor Property Group's 8.1% return over the last year is lagging behind its peers.
Approach 1: Brixmor Property Group Discounted Cash Flow (DCF) Analysis
A Discounted Cash Flow, or DCF, model estimates what a business could be worth today by projecting its future adjusted funds from operations and then discounting those cash flows back to a present value.
For Brixmor Property Group, the model uses adjusted free cash flow to equity, with last twelve month free cash flow at about $693.3 million. Analysts provide cash flow estimates for several years, and Simply Wall St extends those out using its own assumptions. For example, projected free cash flow in 2030 is $599.3 million, with a series of annual projections in between that are discounted back using the 2 stage DCF approach.
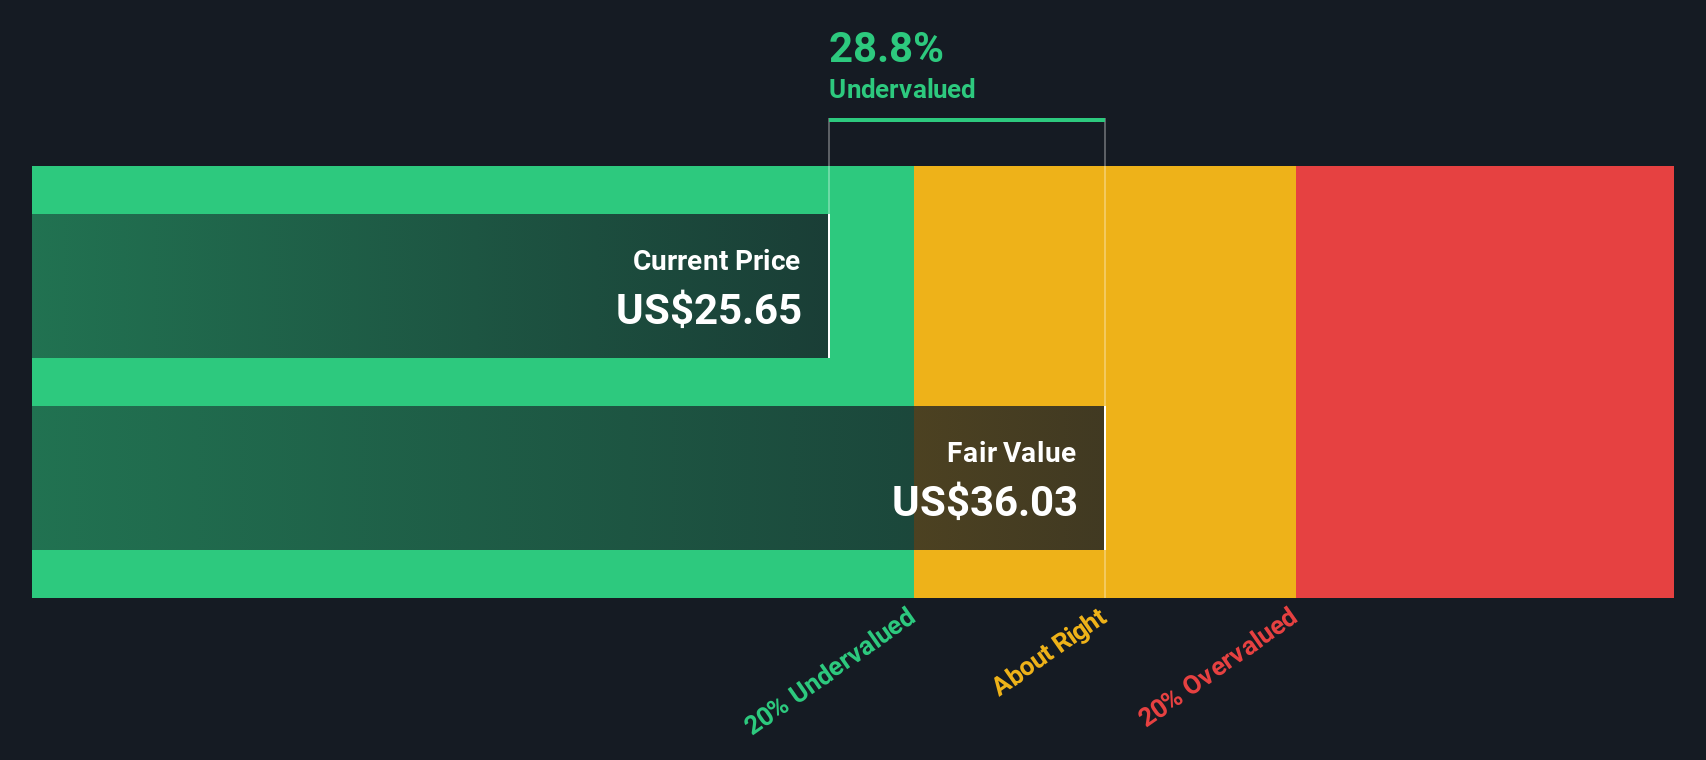
Adding up these discounted cash flows gives an estimated intrinsic value of about $34.63 per share. Compared with the recent share price of $28.53, the model suggests the stock trades at roughly a 17.6% discount to this estimate, which in this model indicates Brixmor may be undervalued on this DCF view.
Result: UNDERVALUED
Our Discounted Cash Flow (DCF) analysis suggests Brixmor Property Group is undervalued by 17.6%. Track this in your watchlist or portfolio, or discover 51 more high quality undervalued stocks.
Approach 2: Brixmor Property Group Price vs Earnings
For a profitable company like Brixmor Property Group, the P/E ratio is a useful way to look at how much you are paying for each dollar of current earnings. It ties the share price directly to the bottom line, which is usually where equity investors focus most.
What counts as a “normal” or “fair” P/E depends on how the market views a company’s growth prospects and risk profile. Higher expected growth or lower perceived risk can support a higher multiple, while slower growth or higher risk tends to justify a lower one.
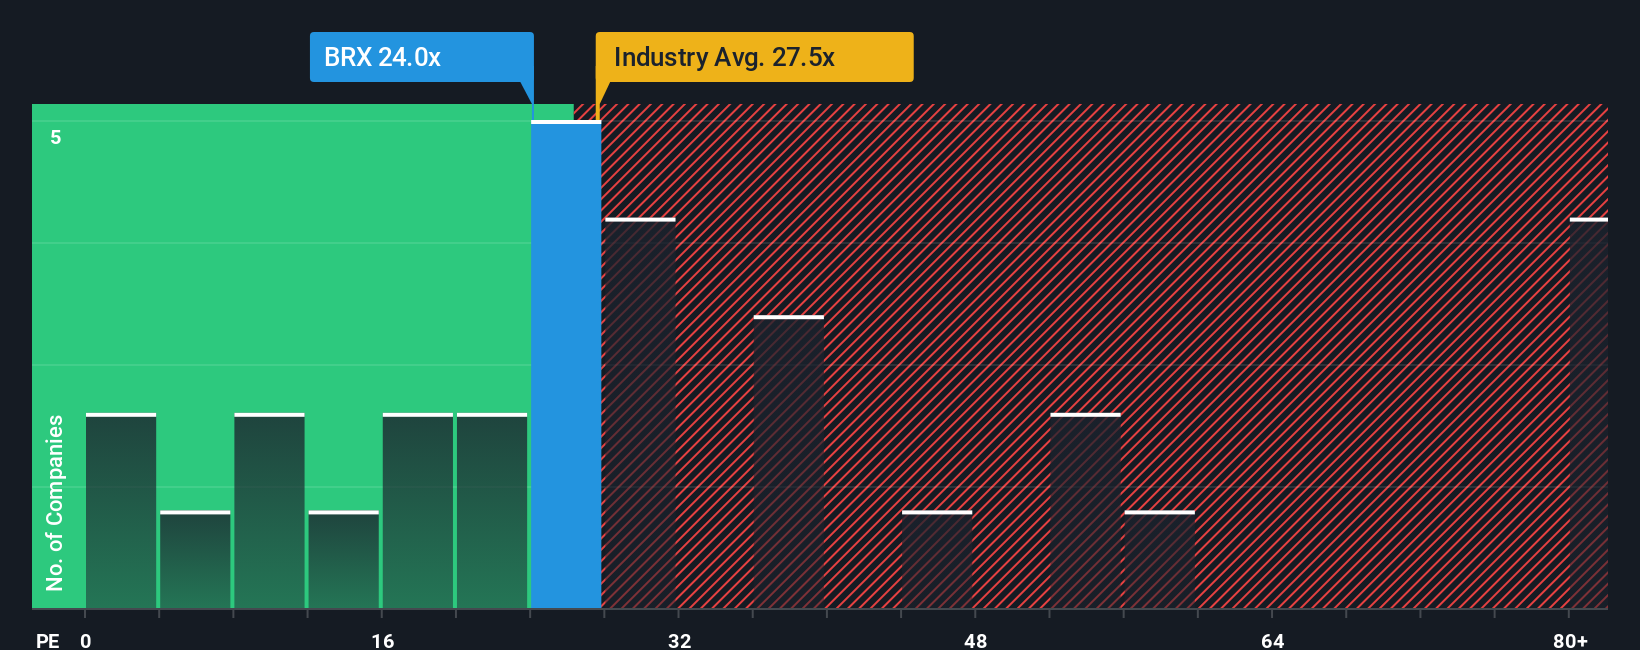
Brixmor currently trades on a P/E of 22.69x, compared with the Retail REITs industry average of 27.33x and a peer group average of 33.31x. Simply Wall St also calculates a proprietary “Fair Ratio” of 29.45x for Brixmor, which is the P/E level it might typically trade on given its earnings growth profile, industry, profit margins, market value and specific risks.
This Fair Ratio can be more informative than a simple peer or industry comparison because it adjusts for the company’s own characteristics rather than assuming all REITs deserve the same multiple. With the actual P/E of 22.69x sitting below the Fair Ratio of 29.45x, the stock currently appears undervalued on this P/E view.
Result: UNDERVALUED
P/E ratios tell one story, but what if the real opportunity lies elsewhere? Start investing in legacies, not executives. Discover our 22 top founder-led companies.
Upgrade Your Decision Making: Choose your Brixmor Property Group Narrative
Earlier we mentioned that there is an even better way to understand valuation. On Simply Wall St’s Community page you can use Narratives, where you or other investors attach a clear story about Brixmor Property Group to specific assumptions for future revenue, earnings, margins and a fair value. You can then compare that fair value with today’s price to decide whether the stock looks appealing or expensive. The Narrative updates automatically as new news or earnings arrive. For example, one investor might build a bullish Brixmor Narrative anchored to the higher analyst targets around US$35 and stronger leasing activity. Another might build a more cautious one closer to the US$26 low target that leans on risks like construction costs and tenant disruption. This gives you a side by side view of how different stories lead to different fair values.
Do you think there's more to the story for Brixmor Property Group? Head over to our Community to see what others are saying!
This article by Simply Wall St is general in nature. We provide commentary based on historical data and analyst forecasts only using an unbiased methodology and our articles are not intended to be financial advice. It does not constitute a recommendation to buy or sell any stock, and does not take account of your objectives, or your financial situation. We aim to bring you long-term focused analysis driven by fundamental data. Note that our analysis may not factor in the latest price-sensitive company announcements or qualitative material. Simply Wall St has no position in any stocks mentioned.
Have feedback on this article? Concerned about the content? Get in touch with us directly. Alternatively, email editorial-team@simplywallst.com