
- LIVE QUOTES
- LEARN
- HELP
 Nasdaq
 Wall Street Journal
EN
Is It Too Late To Consider NRG Energy (NRG) After Its 58% One-Year Surge?
- If you are wondering whether NRG Energy at about US$160.63 still offers value after a strong run, this article walks through how its current price lines up against different ways of thinking about valuation.
- The stock has moved around recently, with returns of 11.6% over the last 7 days, 7.9% over the last 30 days, a 3.3% decline year to date, and 58.4% over the last year, alongside a very large return over the last 3 years and 365.3% over 5 years.
- These moves sit against a backdrop of ongoing interest in power and utilities stocks. Investors regularly react to news about regulation, fuel costs, and capital allocation decisions. For NRG Energy, these kinds of updates can quickly influence how the market weighs its future cash flows against the current share price.
- On our checks, NRG Energy scores 3 out of 6 on valuation, as shown in our valuation scorecard, which suggests some areas look more attractively priced than others. Next, we will walk through the standard valuation approaches behind that score, and then finish with a broader way to think about what the market might be missing.
Approach 1: NRG Energy Discounted Cash Flow (DCF) Analysis
A Discounted Cash Flow, or DCF, model estimates what a company might be worth by projecting its future cash flows and then discounting those amounts back into today’s dollars. It is essentially asking what NRG Energy’s future cash generation could be worth right now.
For NRG Energy, the latest twelve month free cash flow is about $2.0b. Analysts have provided explicit forecasts for several years ahead, and Simply Wall St extends those into a longer run, with projected free cash flow of $4.7b by 2030. The model used here is a 2 Stage Free Cash Flow to Equity approach. It first applies analyst forecasts and then tapers growth assumptions over the following years.
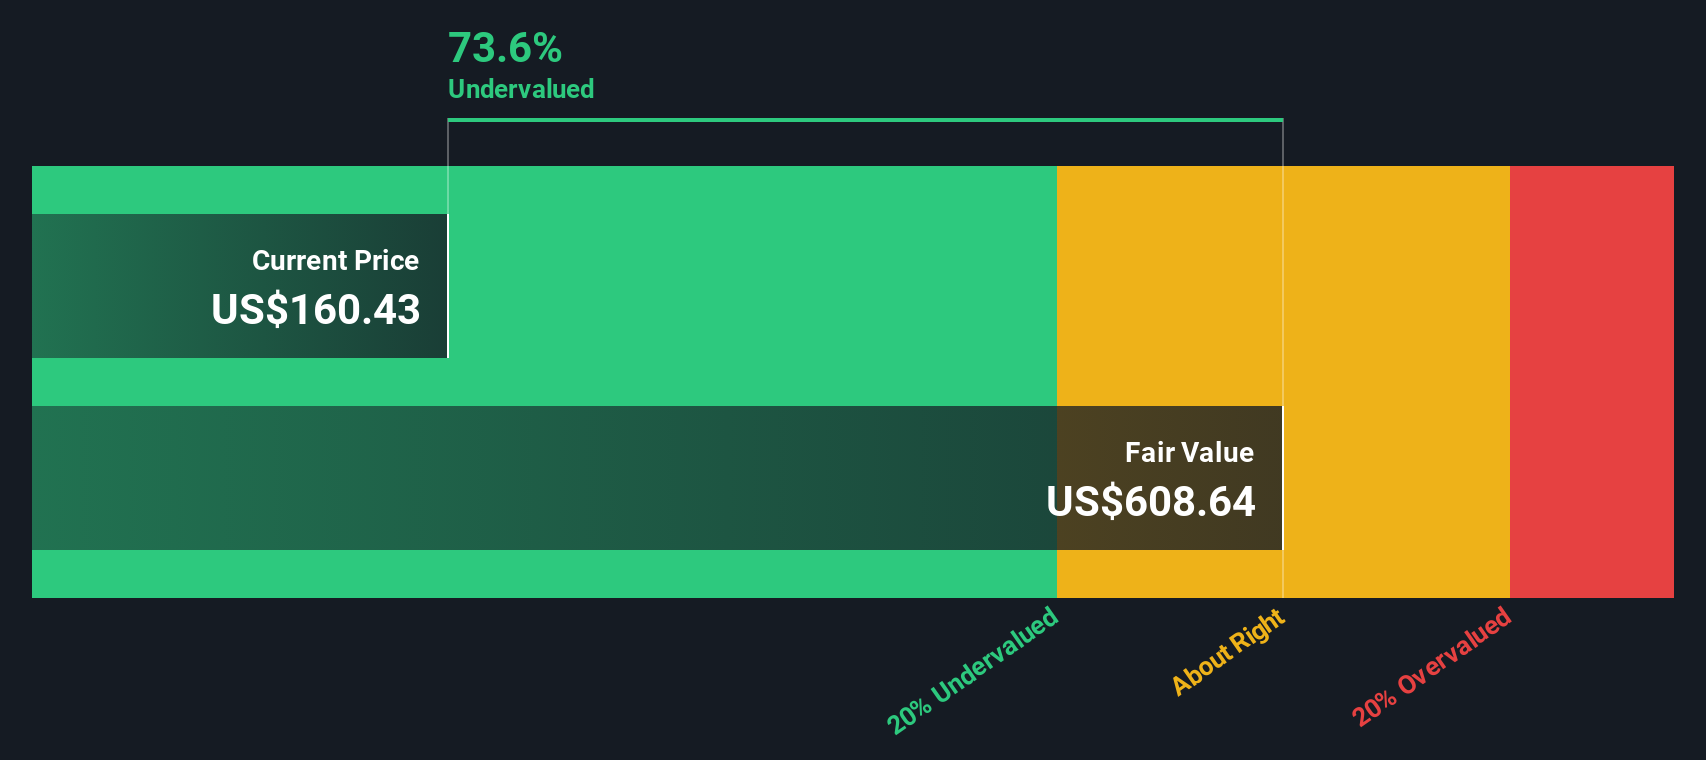
When all those projected cash flows are discounted back, the DCF model suggests an estimated intrinsic value of about $529.90 per share. Against the current share price of about $160.63, this implies the shares are around 69.7% undervalued based on these cash flow assumptions.
Result: UNDERVALUED
Our Discounted Cash Flow (DCF) analysis suggests NRG Energy is undervalued by 69.7%. Track this in your watchlist or portfolio, or discover 51 more high quality undervalued stocks.
Approach 2: NRG Energy Price vs Earnings
For a profitable business like NRG Energy, the P/E ratio is a straightforward way to think about what you are paying for each dollar of earnings. It ties the share price directly to current earnings, which many investors use as a quick sense check on whether a stock looks expensive or cheap.
What counts as a “normal” P/E usually reflects how the market weighs a company’s growth prospects and risk. Higher expected growth or perceived resilience can justify a higher P/E, while more uncertainty can keep that multiple lower.
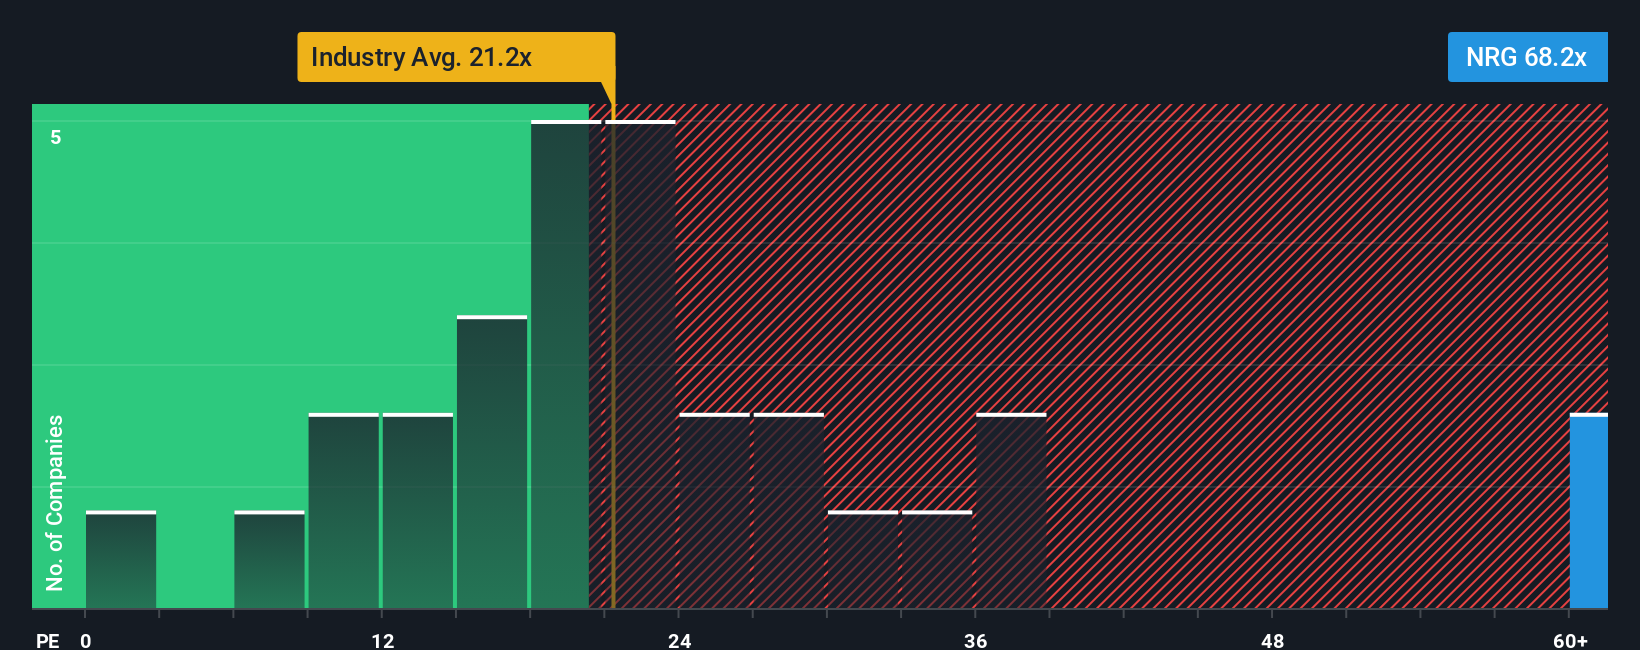
NRG Energy currently trades on a P/E of about 25.1x. That sits above the Electric Utilities industry average of about 21.5x and also above a peer average of around 19.8x. Simply Wall St’s Fair Ratio for NRG Energy is 32.3x. This is a proprietary estimate of what the P/E might be given factors such as earnings growth, industry, profit margins, market cap and risk profile.
The Fair Ratio can be more informative than a simple peer or industry comparison because it adjusts for NRG Energy’s specific characteristics rather than assuming all utilities should trade at the same multiple. With the current P/E of 25.1x below the Fair Ratio of 32.3x, this framework indicates that the shares may be undervalued on an earnings basis.
Result: UNDERVALUED
P/E ratios tell one story, but what if the real opportunity lies elsewhere? Start investing in legacies, not executives. Discover our 22 top founder-led companies.
Upgrade Your Decision Making: Choose your NRG Energy Narrative
Earlier we mentioned that there is an even better way to think about valuation. On Simply Wall St’s Community page you can use Narratives, where you set your own story for NRG Energy or pick from others, link that story to explicit assumptions about future revenue, earnings and margins, and let the platform turn it into a fair value that updates when fresh news or earnings arrive. This then makes it easier to compare that fair value with the current price and decide whether NRG looks more attractive or less attractive to you, whether you lean closer to a bullish view that could justify a fair value around US$312.69, a more cautious stance closer to US$145, or a position near the consensus around US$201.96.
For NRG Energy however we'll make it really easy for you with previews of two leading NRG Energy Narratives:
Fair value: about US$312.69 per share
Implied discount to that fair value: about 48.6% compared to the recent price of US$160.63, using ((312.69 - 160.63) / 312.69)
Assumed revenue growth used in this view: about 29.98% a year
- Assumes NRG Energy converts its LS Power gas assets, data center agreements and virtual power platforms into higher recurring earnings and EBITDA than current consensus.
- Builds in faster expansion of residential virtual power plants and smart home services, with higher margin recurring revenue as more homes electrify.
- Factors in supportive policy incentives, grid reliability programs and capacity payments that help fund new projects and stabilize free cash flow.
Fair value: about US$145.00 per share
Implied premium to that fair value: about 10.8% compared to the recent price of US$160.63, using ((160.63 - 145.00) / 145.00)
Assumed revenue growth used in this view: about 2.84% a year
- Questions how much long term benefit NRG Energy can retain from power price strength and data center demand given its large fossil portfolio and rising regulatory and carbon cost risks.
- Builds in slower revenue growth and lower future P/E, with concern that recent share price moves already reflect much of the improvement in earnings and cash flows.
- Highlights capital intensity, potential balance sheet pressure and execution risk on data center projects and grid upgrades as reasons the market could be pricing in too much optimism.
Together, these Narratives frame a wide range between a more optimistic view anchored around about US$313 per share and a more cautious stance closer to US$145. If you want to see how other investors are joining the debate and how their numbers connect to fair value estimates, Curious how numbers become stories that shape markets? Explore Community Narratives.
Do you think there's more to the story for NRG Energy? Head over to our Community to see what others are saying!

This article by Simply Wall St is general in nature. We provide commentary based on historical data and analyst forecasts only using an unbiased methodology and our articles are not intended to be financial advice. It does not constitute a recommendation to buy or sell any stock, and does not take account of your objectives, or your financial situation. We aim to bring you long-term focused analysis driven by fundamental data. Note that our analysis may not factor in the latest price-sensitive company announcements or qualitative material. Simply Wall St has no position in any stocks mentioned.
Have feedback on this article? Concerned about the content? Get in touch with us directly. Alternatively, email editorial-team@simplywallst.com