
- LIVE QUOTES
- LEARN
- HELP
 Nasdaq
 Wall Street Journal
EN
Is It Too Late To Reassess Fabrinet (FN) After A 120% One Year Surge?
- If you are wondering whether Fabrinet's share price still reflects fair value after its strong run, this article will walk through what the numbers are actually saying about the stock.
- The shares last closed at US$465.53, with returns of 10% over 7 days, 0.6% over 30 days, a 2.9% decline year to date, and 120.4% over the past year. Recent moves may have shifted how investors view both its potential and its risks.
- Recent coverage has continued to focus on Fabrinet as a key US tech name on the NYSE, with investors closely watching how the share price responds to ongoing sector sentiment and company specific updates. That backdrop helps explain why short term swings, such as the 7 day move, are attracting attention after such strong 1 year and multi year returns of 275.4% over 3 years and 440.3% over 5 years.
- On Simply Wall St's valuation checks, Fabrinet currently scores 0 out of 6, as shown in its valuation score. Next we will look at how different methods assess the stock and then circle back to an even more complete way to think about value at the end of the article.
Fabrinet scores just 0/6 on our valuation checks. See what other red flags we found in the full valuation breakdown.
Approach 1: Fabrinet Discounted Cash Flow (DCF) Analysis
A Discounted Cash Flow, or DCF, model takes estimates of a company’s future cash flows and discounts them back to today using a required rate of return. The result is an estimate of what the entire business could be worth in today’s dollars.
For Fabrinet, the model used is a 2 Stage Free Cash Flow to Equity approach based on cash flow projections. The latest twelve month Free Cash Flow is about $155.9m. Analysts provide forecasts for the next few years, and Simply Wall St then extends those out, with ten year projections that reach an estimated Free Cash Flow of $835.4m in 2035, all in $.
After discounting each of those projected cash flows back to today, the model arrives at an estimated intrinsic value of around $326.36 per share for NYSE:FN. When this is compared with the recent share price of US$465.53, the DCF output suggests the stock is 42.6% above this valuation according to this method.
Result: OVERVALUED
Our Discounted Cash Flow (DCF) analysis suggests Fabrinet may be overvalued by 42.6%. Discover 51 high quality undervalued stocks or create your own screener to find better value opportunities.

Approach 2: Fabrinet Price vs Earnings
For profitable companies like Fabrinet, the P/E ratio is a common way to think about value because it links what you pay directly to the earnings the business is currently generating.
What counts as a "normal" P/E depends on how much growth investors expect and how much risk they see in those earnings. Higher expected growth or lower perceived risk can justify a higher P/E, while slower growth or higher risk usually lines up with a lower multiple.
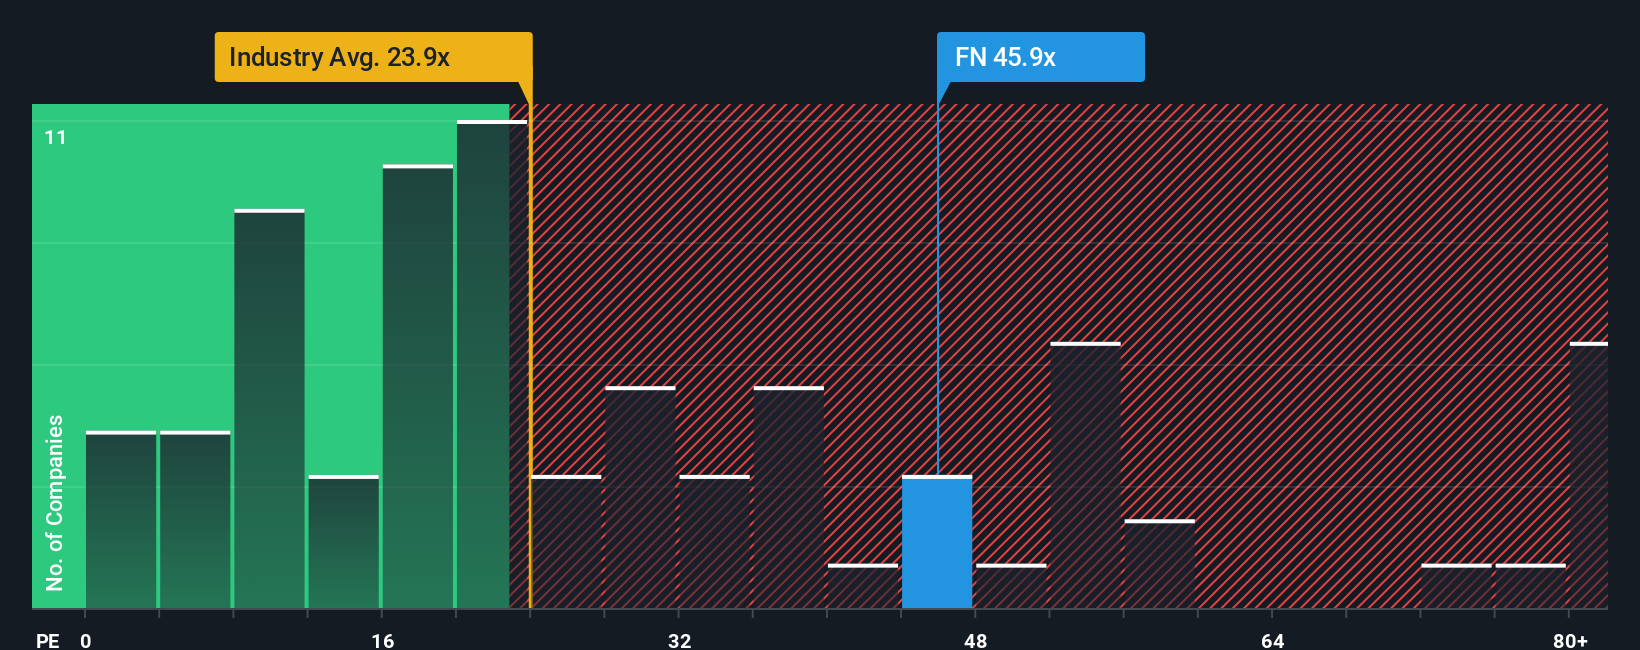
Fabrinet currently trades on a P/E of 44.23x. That sits above the Electronic industry average of 27.08x and above the peer average of 39.04x. Simply Wall St also provides a proprietary “Fair Ratio” of 36.49x. This Fair Ratio aims to capture what a reasonable P/E might be for Fabrinet specifically, given factors like its earnings growth profile, industry, profit margins, market cap and company specific risks.
Because the Fair Ratio is tailored to the company, it can be more informative than a simple comparison with peers or the broader industry, which may have very different characteristics.
Comparing Fabrinet’s current P/E of 44.23x with its Fair Ratio of 36.49x suggests the shares are trading above this tailored benchmark.
Result: OVERVALUED
P/E ratios tell one story, but what if the real opportunity lies elsewhere? Start investing in legacies, not executives. Discover our 22 top founder-led companies.
Upgrade Your Decision Making: Choose your Fabrinet Narrative
Earlier we mentioned that there is an even better way to think about value than a single DCF or P/E snapshot, and on Simply Wall St that takes the form of Narratives, which let you spell out your story for Fabrinet, tie that story to specific forecasts for revenue, earnings and margins, and see the fair value those assumptions imply, all in one place on the Community page used by millions of investors.
A Narrative connects three pieces in a straight line: how you think Fabrinet’s business will play out, what that means for its financials over time, and what you see as a reasonable fair value today, which you can then compare directly with the current share price to help you decide whether the stock looks expensive or cheap on your numbers.
Because Narratives on Simply Wall St are updated when new earnings, guidance or news is entered, your view does not sit still. It adjusts as fresh information comes in, so your fair value stays aligned with what you believe is actually happening in the business.
For Fabrinet, one investor might side with the bearish cohort and anchor on a fair value close to US$225.88 per share, while another might lean toward the more optimistic view that points to a fair value near US$600.00. Narratives make those different viewpoints, and the assumptions behind them, transparent and directly comparable.
For Fabrinet however, we will make it really easy for you with previews of two leading Fabrinet Narratives:
Fair value in this bullish narrative: US$600.00 per share
Implied discount to this fair value versus the last close of US$465.53: about 22.4%
Assumed annual revenue growth in this scenario: 23.31%
- Backers of this view expect Fabrinet to benefit from stronger revenue growth, higher profit margins and a richer future P/E multiple than previously modeled, supported by updated analyst assumptions.
- The narrative leans on increased fair value estimates, slightly higher discount rates, and upgraded expectations for revenue growth and margins to support a higher long term valuation.
- It also factors in recent guidance, including revenue and earnings expectations plus ongoing share buybacks, as part of a case that the shares could justify a higher price over time if these assumptions hold.
Fair value in this bearish narrative: about US$324.57 per share
Implied premium to this fair value versus the last close of US$465.53: about 43.4%
Assumed annual revenue growth in this scenario: 19.15%
- This view highlights risks from geopolitical tensions, regulation and automation trends that could pressure margins, raise costs and challenge Fabrinet's existing operating model.
- It also points to customer concentration and rising labor costs as factors that could introduce earnings volatility and limit long term expansion, even if revenue continues to grow.
- Supporters of this narrative use a lower fair value, a more modest revenue growth outlook and a reduced future P/E multiple to argue that the current share price already reflects very optimistic expectations.
Do you think there's more to the story for Fabrinet? Head over to our Community to see what others are saying!

This article by Simply Wall St is general in nature. We provide commentary based on historical data and analyst forecasts only using an unbiased methodology and our articles are not intended to be financial advice. It does not constitute a recommendation to buy or sell any stock, and does not take account of your objectives, or your financial situation. We aim to bring you long-term focused analysis driven by fundamental data. Note that our analysis may not factor in the latest price-sensitive company announcements or qualitative material. Simply Wall St has no position in any stocks mentioned.
Have feedback on this article? Concerned about the content? Get in touch with us directly. Alternatively, email editorial-team@simplywallst.com