
- LIVE QUOTES
- LEARN
- HELP
 Nasdaq
 Wall Street Journal
EN
Is It Time To Revisit Tenable Holdings (TENB) After Recent Price Rebound?
- If you are wondering whether Tenable Holdings at around US$22.55 is starting to look interesting again, the key question is whether the current share price lines up with the company’s underlying value.
- The stock has moved sharply in the short term, with a 14.4% return over the last 7 days. Returns over 30 days, year to date and the past few years, including a 43.1% return over 1 year, paint a more mixed picture of risk and sentiment.
- Recent coverage around Tenable has focused on its role in cybersecurity and the broader sector’s changing risk profile. This helps frame why investors may be reassessing the shares. This backdrop is important context for the recent swings in the share price and sets up the question of whether the current level is justified.
- Tenable currently scores 5 out of 6 on our valuation checks, suggesting many of our standard methods point to a pricing gap. Next we will look at those approaches in detail before finishing with a different way to think about what the stock might be worth.
Find out why Tenable Holdings's -43.1% return over the last year is lagging behind its peers.
Approach 1: Tenable Holdings Discounted Cash Flow (DCF) Analysis
A Discounted Cash Flow model estimates what a company might be worth by projecting its future cash flows and then discounting those back to today’s value using a required rate of return.
For Tenable Holdings, the model uses Free Cash Flow to Equity, starting from last twelve month free cash flow of about $253.4 million. Analysts supply detailed projections for the earlier years, and Simply Wall St then extrapolates further out, including a projected free cash flow of $304 million in 2030 as part of a 2 stage framework.
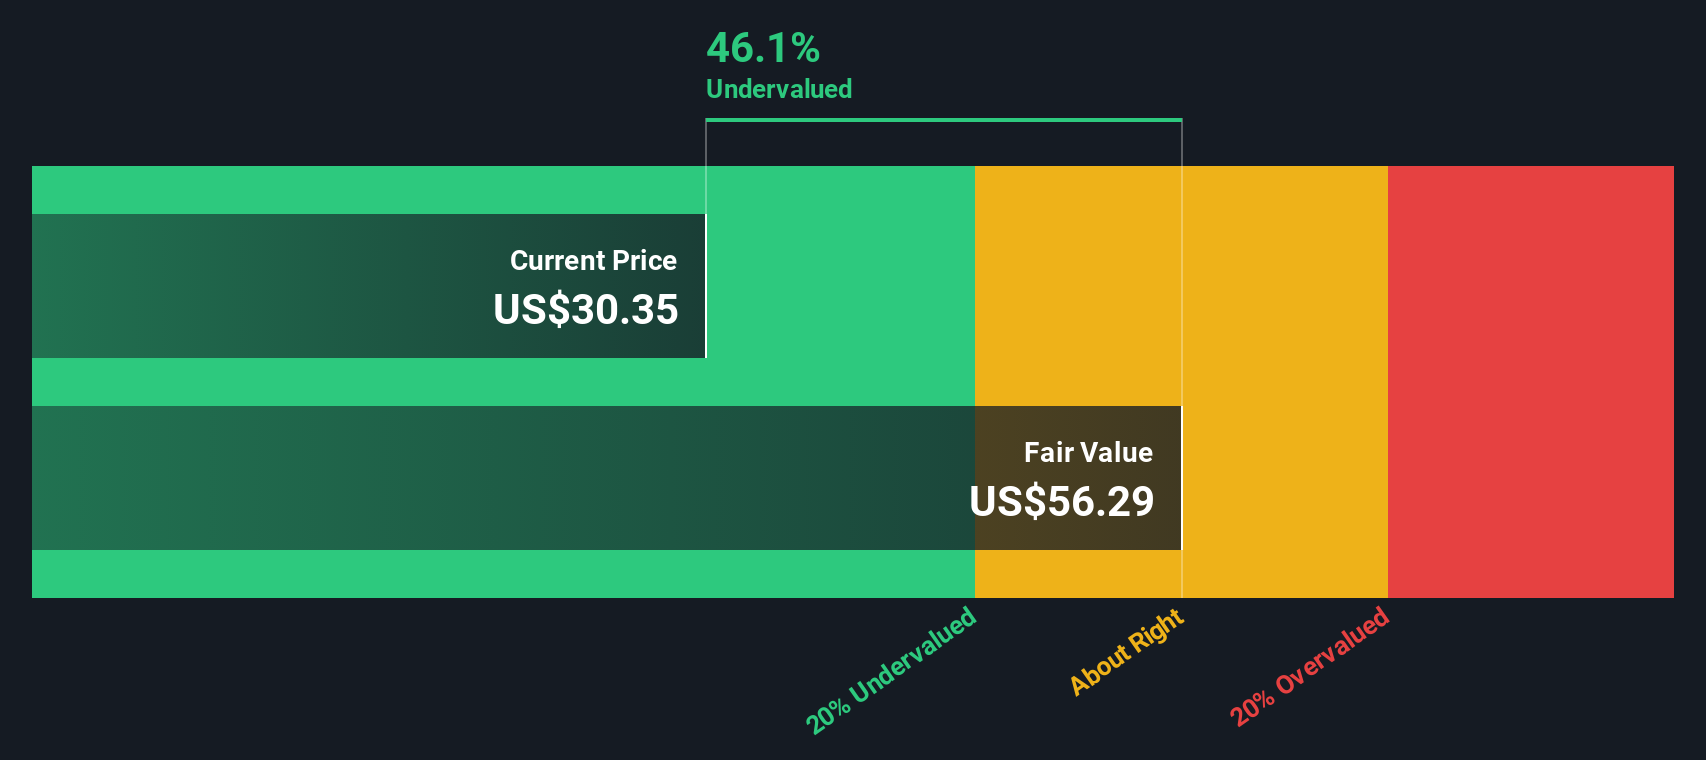
Pulling all those projected cash flows together, the DCF model suggests an intrinsic value of about $39.68 per share. Against a recent share price of around $22.55, this output implies the shares trade at roughly a 43.2% discount to that estimate. This points to an undervalued stock based on this method alone.
Result: UNDERVALUED
Our Discounted Cash Flow (DCF) analysis suggests Tenable Holdings is undervalued by 43.2%. Track this in your watchlist or portfolio, or discover 52 more high quality undervalued stocks.
Approach 2: Tenable Holdings Price vs Sales
For companies where profitability is still developing or earnings are volatile, the P/S ratio can be a useful way to compare what investors are paying for each dollar of revenue.
Higher growth expectations and lower perceived risk tend to support a higher “normal” P/S multiple, while slower growth or higher risk usually call for a lower one. Context therefore matters when you look at the headline number.
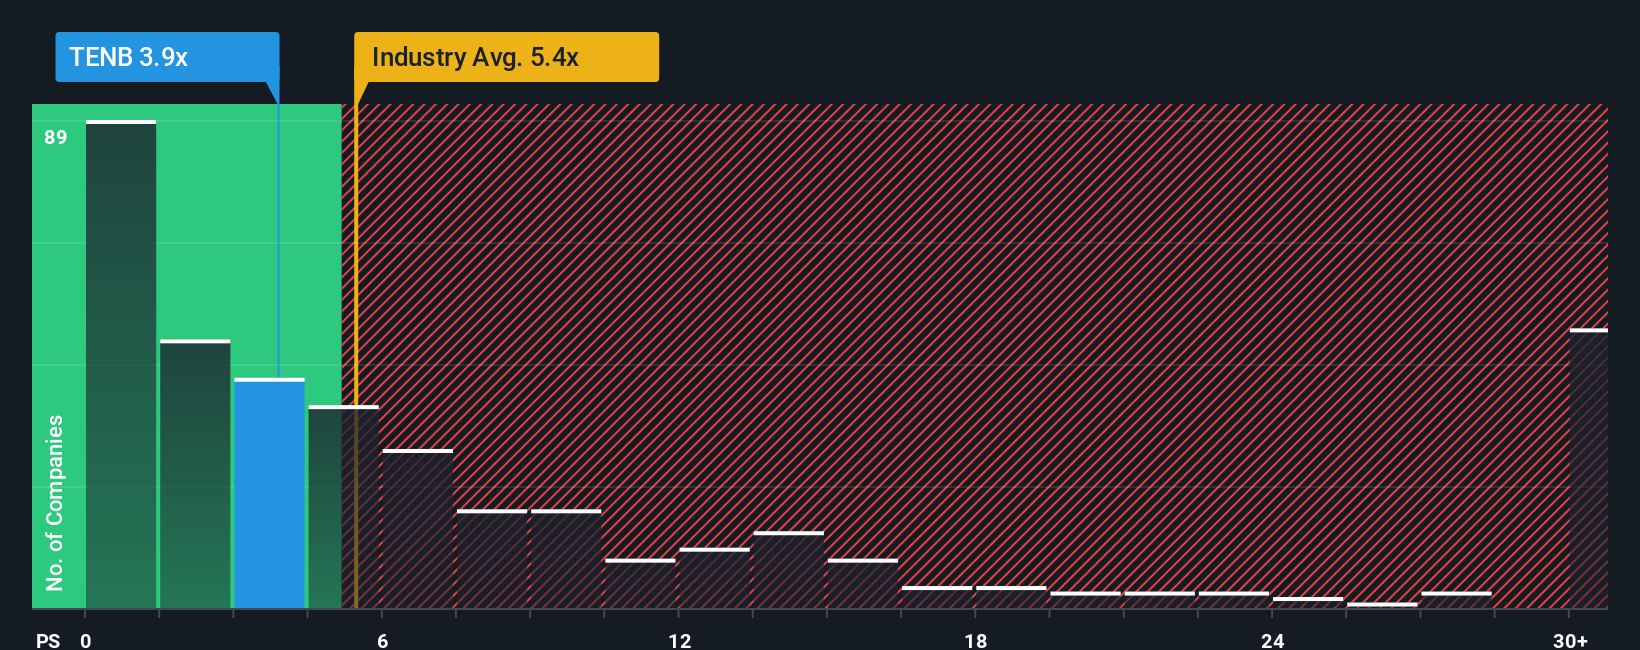
Tenable Holdings currently trades on a P/S ratio of 2.67x. That sits below the Software industry average of 3.84x and also below the peer average of 3.68x. On those simple comparisons alone, the shares appear cheaper than many peers in the same space.
Simply Wall St’s Fair Ratio for Tenable, at 3.44x, is a proprietary estimate of what the P/S multiple might be, given factors such as earnings growth, profit margins, industry, market cap and company specific risks. This is designed to be more tailored than a basic industry or peer comparison, which cannot easily adjust for these differences between companies.
Compared with this Fair Ratio of 3.44x, the current P/S of 2.67x suggests the stock trades below that tailored benchmark and indicates an undervalued reading on this metric.
Result: UNDERVALUED
P/S ratios tell one story, but what if the real opportunity lies elsewhere? Start investing in legacies, not executives. Discover our 22 top founder-led companies.
Upgrade Your Decision Making: Choose your Tenable Holdings Narrative
Earlier we mentioned that there is an even better way to think about valuation. Narratives on Simply Wall St let you attach a clear story about Tenable Holdings to the numbers by linking your view of its future revenue, earnings and margins to a financial forecast, a Fair Value, and ultimately a simple buy or sell framework that compares that Fair Value to the current price. This is all available within an easy tool on the Community page that updates automatically when fresh information like earnings or news arrives. One investor might build a more optimistic Tenable view that lines up with a Fair Value of about US$45.00, while another might prefer a more cautious stance closer to US$29.00. Both of these perspectives can sit side by side so you can see exactly which assumptions you agree with and which ones you want to adjust for yourself.
Do you think there's more to the story for Tenable Holdings? Head over to our Community to see what others are saying!

This article by Simply Wall St is general in nature. We provide commentary based on historical data and analyst forecasts only using an unbiased methodology and our articles are not intended to be financial advice. It does not constitute a recommendation to buy or sell any stock, and does not take account of your objectives, or your financial situation. We aim to bring you long-term focused analysis driven by fundamental data. Note that our analysis may not factor in the latest price-sensitive company announcements or qualitative material. Simply Wall St has no position in any stocks mentioned.
Have feedback on this article? Concerned about the content? Get in touch with us directly. Alternatively, email editorial-team@simplywallst.com