
- LIVE QUOTES
- LEARN
- HELP
 Nasdaq
 Wall Street Journal
EN
Has Sarepta Therapeutics (SRPT) Fallen Too Far After Its Sharp Multi‑Year Share Price Slide?
- If you are wondering whether Sarepta Therapeutics shares are now pricing in too much pessimism or hiding potential value, this article will walk through what the numbers are actually saying about the stock.
- The share price closed at US$18.33 recently, with returns of a 9.6% decline over 7 days, 23.1% decline over 30 days, 14.0% decline year to date, 83.3% decline over 1 year, 84.8% decline over 3 years and 79.8% decline over 5 years. These moves will naturally raise questions about risk and reward at today's level.
- Recent coverage around Sarepta has focused on how the company is positioned within biotech and what its current share price implies for long term holders versus new investors. This helps frame these sharp moves in context. This mix of sentiment and attention can influence how quickly the market reacts to any new information about the business or its pipeline.
- Interestingly, Sarepta scores a 5 out of 6 valuation score, suggesting that many standard checks see the shares as undervalued. We will look at how different methods like DCFs and multiples arrive at that view before finishing with a more complete way to think about valuation overall.
Find out why Sarepta Therapeutics's -83.3% return over the last year is lagging behind its peers.
Approach 1: Sarepta Therapeutics Discounted Cash Flow (DCF) Analysis
A Discounted Cash Flow, or DCF, model estimates what a company might be worth by projecting its future cash flows and then discounting them back to today’s value. It is essentially asking what those future dollars are worth in today’s terms.
For Sarepta Therapeutics, the model used is a 2 Stage Free Cash Flow to Equity approach based on cash flow projections. The latest twelve month free cash flow is a loss of $360.0 million, so the story here is very much about what the company could generate in the future rather than what it is producing today.
Analysts and extrapolated estimates indicate free cash flow of $273.5 million in 2026 and $466.0 million by 2030. Simply Wall St then extends projections further out to 2035 using its own growth assumptions. When all these projected cash flows are discounted back, the model arrives at an estimated intrinsic value of about $75.28 per share.
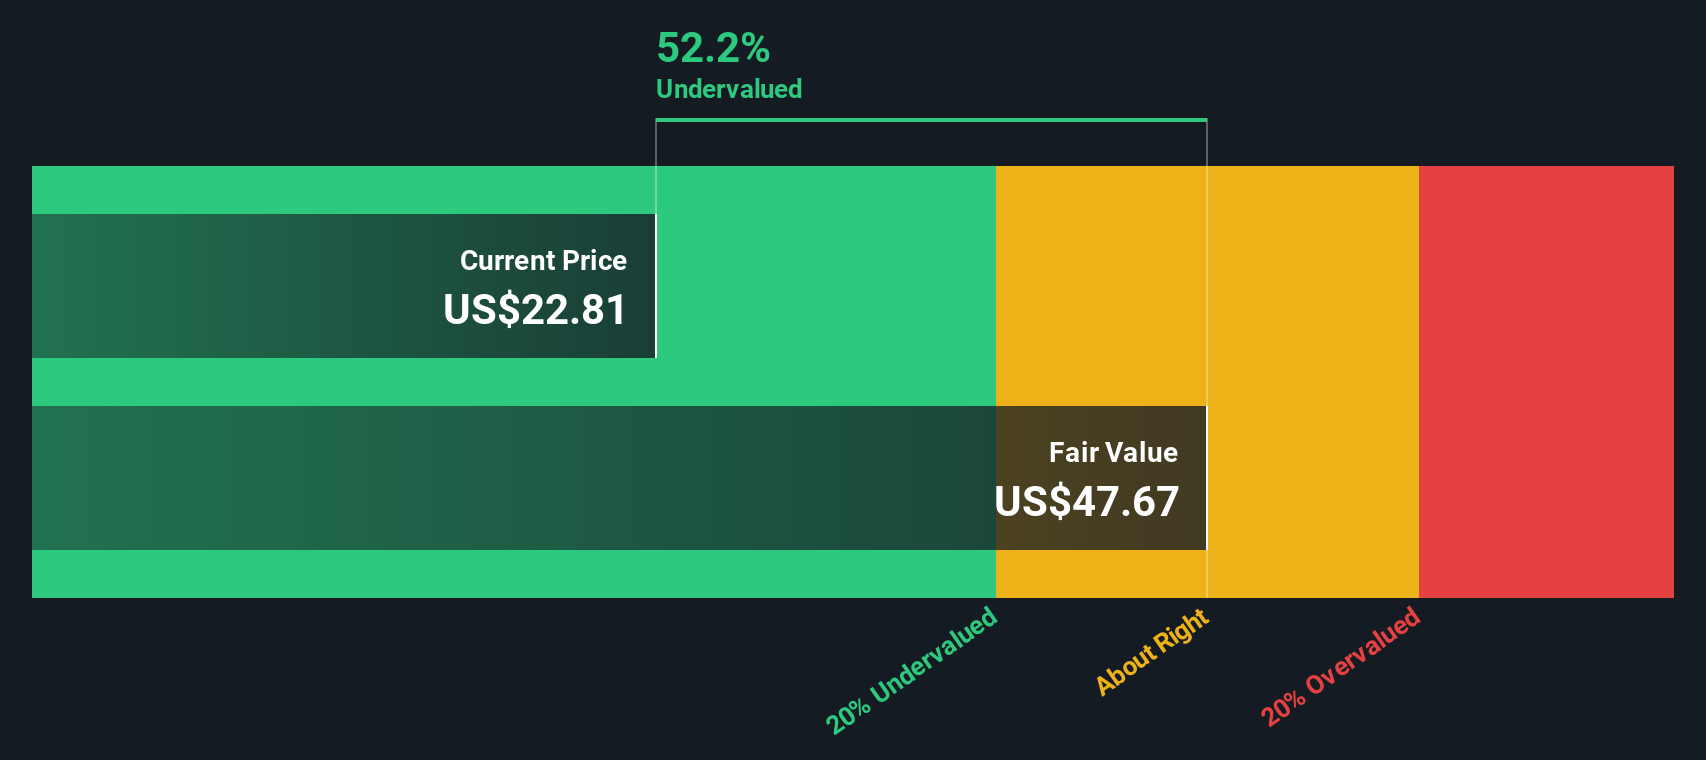
Against a recent share price of $18.33, this comparison suggests the stock is 75.6% below that DCF estimate, indicating a wide valuation gap according to this method.
Result: UNDERVALUED
Our Discounted Cash Flow (DCF) analysis suggests Sarepta Therapeutics is undervalued by 75.6%. Track this in your watchlist or portfolio, or discover 51 more high quality undervalued stocks.
Approach 2: Sarepta Therapeutics Price vs Sales
For companies where earnings are not yet stable or are in a loss, the P/S ratio is often a more useful yardstick than P/E because it compares what you pay for each dollar of revenue rather than each dollar of profit. It is a simple way to see how the market is valuing the business relative to its current sales base.
What investors usually see as a normal or fair P/S will move around with growth expectations and risk. Higher expected growth or lower perceived risk tends to support a higher multiple, while slower growth or higher uncertainty usually goes with a lower one.
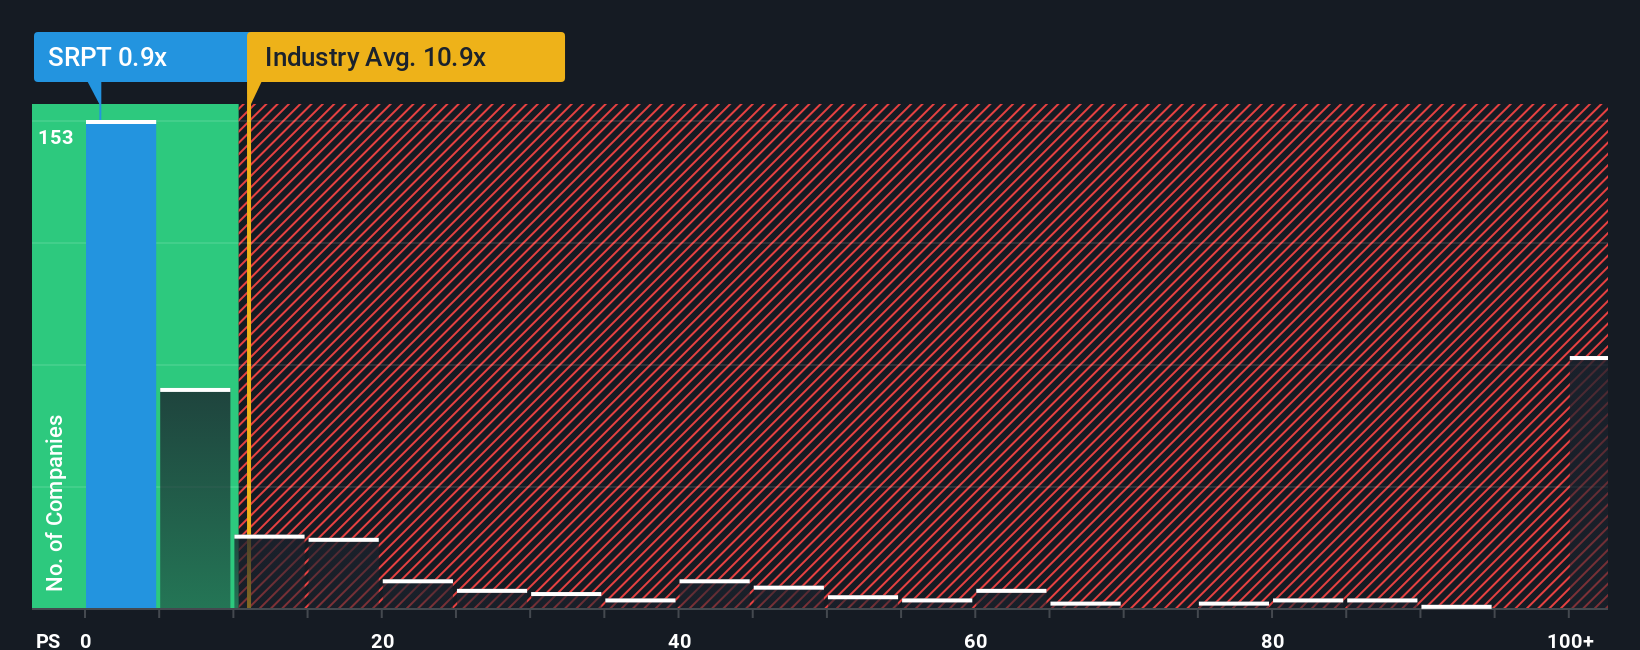
Sarepta Therapeutics currently trades on a P/S of 0.80x. That sits well below the Biotechs industry average P/S of 12.34x and the peer average of 15.66x. Simply Wall St’s Fair Ratio metric for Sarepta, which estimates an appropriate P/S based on factors like earnings growth, industry, profit margin, market cap and risk, is 1.08x. Because it is tailored to the company rather than just copying what peers trade on, the Fair Ratio can be a more targeted anchor for assessing price. Comparing the Fair Ratio of 1.08x with the current 0.80x suggests Sarepta trades below that company specific range.
Result: UNDERVALUED
P/S ratios tell one story, but what if the real opportunity lies elsewhere? Start investing in legacies, not executives. Discover our 23 top founder-led companies.
Upgrade Your Decision Making: Choose your Sarepta Therapeutics Narrative
Earlier we mentioned that there is an even better way to understand valuation, so let us introduce you to Narratives, which are simply the stories behind your numbers, where you set your own view of Sarepta Therapeutics’ future revenue, earnings, margins and fair value, then see how that stacks up against the current share price.
On Simply Wall St, Narratives live in the Community page and act as an easy to use bridge that connects what you think is happening in the business, to a set of financial forecasts, and then to a fair value that you can compare directly with today’s price to help decide whether you see the stock as attractive, expensive or somewhere in between.
Because Narratives refresh when new filings, earnings or news arrive, you can quickly see how different views evolve. For example, one Sarepta Narrative might lean toward the higher fair value area around the US$55.90 to US$80.00 range, while another might sit closer to the lower end near US$5.00. This gives you a clear sense of how your own assumptions compare with other investors’ expectations.
Do you think there's more to the story for Sarepta Therapeutics? Head over to our Community to see what others are saying!

This article by Simply Wall St is general in nature. We provide commentary based on historical data and analyst forecasts only using an unbiased methodology and our articles are not intended to be financial advice. It does not constitute a recommendation to buy or sell any stock, and does not take account of your objectives, or your financial situation. We aim to bring you long-term focused analysis driven by fundamental data. Note that our analysis may not factor in the latest price-sensitive company announcements or qualitative material. Simply Wall St has no position in any stocks mentioned.
Have feedback on this article? Concerned about the content? Get in touch with us directly. Alternatively, email editorial-team@simplywallst.com