
- LIVE QUOTES
- LEARN
- HELP
 Nasdaq
 Wall Street Journal
EN
A Look At Versant Media Group (VSNT) Valuation After Recent Share Price Weakness
Why Versant Media Group Is On Investors’ Radar Today
Versant Media Group (VSNT) has drawn fresh attention after a period of weak share performance, with the stock down about 16% over the past month and around 38% year to date.
For investors tracking U.S. media names, this recent slide, alongside reported revenue of $6,801 and net income of $1,125, raises questions about how the company’s cable networks and digital platforms are being valued in today’s market.
See our latest analysis for Versant Media Group.
With the share price now at $28.87 and a 30 day share price return of a 16.1% decline contributing to a 38.1% decline year to date, recent losses suggest sentiment has cooled rather than built momentum. This can shift how investors weigh Versant Media Group’s earnings power and risk profile.
If this pullback has you reassessing your media exposure, it could be a good time to widen your search and check out 23 top founder-led companies as a fresh source of ideas.
With Versant Media Group trading at $28.87, annual revenue of $6,801 and net income of $1,125, the key question is whether recent weakness has left the stock undervalued or if the market is already pricing in future growth.
Price-to-Earnings of 3.7x: Is It Justified?
At $28.87, Versant Media Group is on a P/E of 3.7x, which the data flags as good value compared both to US media peers and the wider industry.
The P/E ratio compares the company’s share price to its earnings, so a lower number can suggest the market is assigning a relatively modest value to each dollar of profit. For a media group with reported net income of $1,125 on revenue of $6,801, that gap versus peers is notable if you are weighing how earnings quality and growth expectations are being priced.
Here, VSNT’s 3.7x P/E screens as materially lower than both the US Media industry average of 15.1x and a peer average of 24.2x. That is a wide spread, and it implies investors are paying less for VSNT’s earnings than for similar companies, even though VSNT is assessed as having high quality earnings.
See what the numbers say about this price — find out in our valuation breakdown.
Result: Price-to-Earnings of 3.7x (UNDERVALUED)
However, you still need to weigh risks such as an annual revenue decline of 2.1% and the company’s relatively recent 2025 incorporation and operating track record.
Find out about the key risks to this Versant Media Group narrative.
Another View: What Our DCF Model Suggests
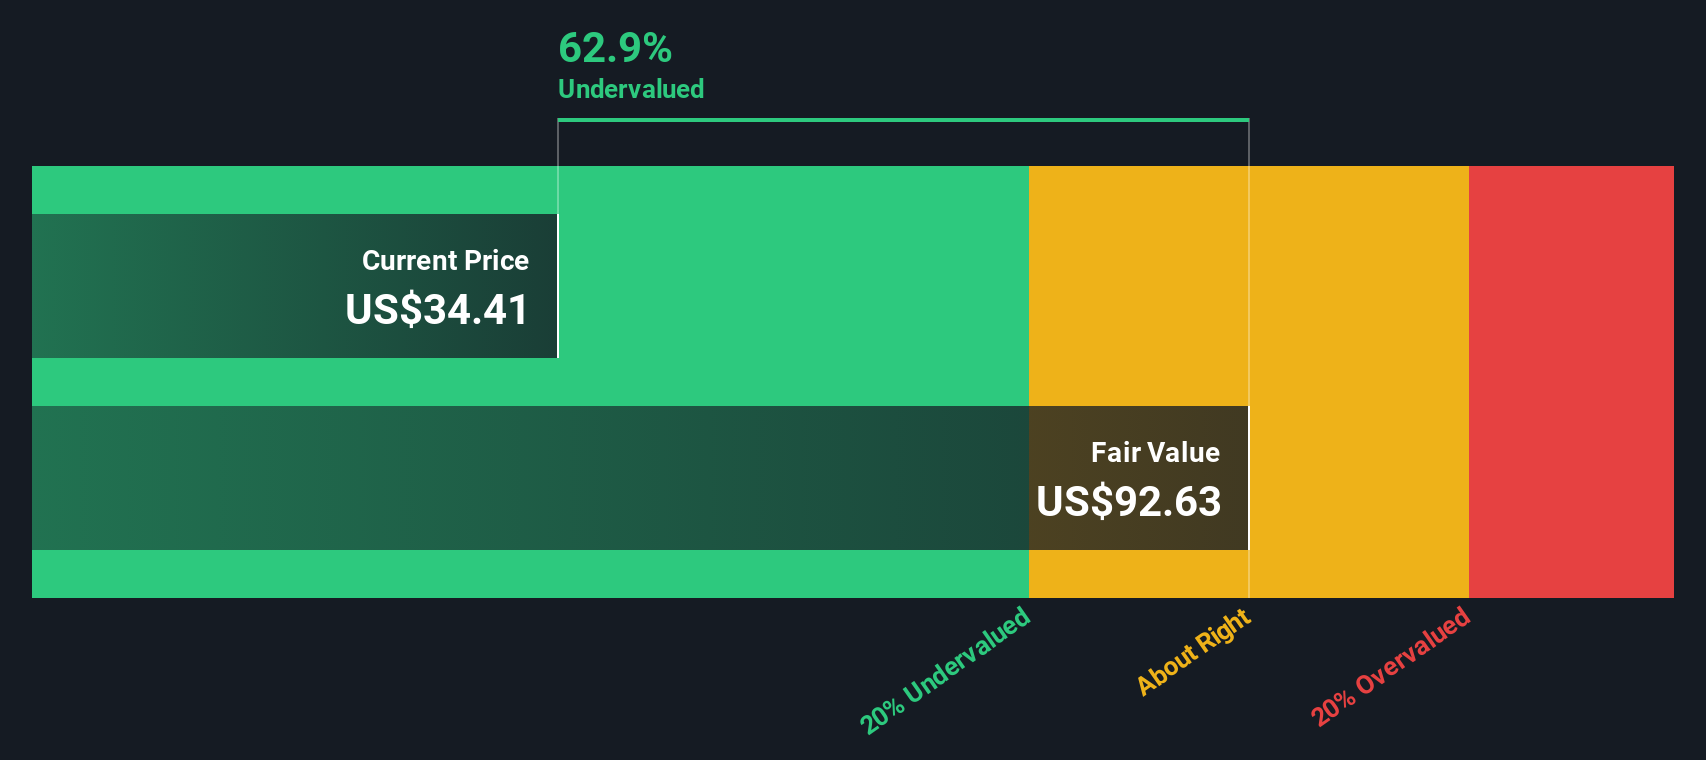
While the 3.7x P/E hints at good value, our DCF model paints an even more aggressive picture. With the share price at $28.87 and an estimated future cash flow value of $111.81, Versant Media Group is flagged as trading well below that mark. Does that gap signal mispricing, or does it instead reflect very cautious expectations?
Look into how the SWS DCF model arrives at its fair value.
Simply Wall St performs a discounted cash flow (DCF) on every stock in the world every day (check out Versant Media Group for example). We show the entire calculation in full. You can track the result in your watchlist or portfolio and be alerted when this changes, or use our stock screener to discover 51 high quality undervalued stocks. If you save a screener we even alert you when new companies match - so you never miss a potential opportunity.
Build Your Own Versant Media Group Narrative
If you look at the numbers and reach a different conclusion, or simply prefer to test your own view, you can build a custom thesis in just a few minutes using Do it your way.
A good starting point is our analysis highlighting 1 key reward investors are optimistic about regarding Versant Media Group.
Looking For More Investment Ideas?
If Versant Media Group has sharpened your focus, do not stop here. Use the Simply Wall St screener to uncover fresh ideas that fit your style.
- Target potential value opportunities by checking stocks that screen as attractively priced on earnings and quality through 51 high quality undervalued stocks.
- Prioritise resilience in your portfolio by using 83 resilient stocks with low risk scores to find companies with lower identified risk scores.
- Hunt for under the radar names by scanning our screener containing 24 high quality undiscovered gems that combine solid fundamentals with less market attention.
This article by Simply Wall St is general in nature. We provide commentary based on historical data and analyst forecasts only using an unbiased methodology and our articles are not intended to be financial advice. It does not constitute a recommendation to buy or sell any stock, and does not take account of your objectives, or your financial situation. We aim to bring you long-term focused analysis driven by fundamental data. Note that our analysis may not factor in the latest price-sensitive company announcements or qualitative material. Simply Wall St has no position in any stocks mentioned.
Have feedback on this article? Concerned about the content? Get in touch with us directly. Alternatively, email editorial-team@simplywallst.com