
- LIVE QUOTES
- LEARN
- HELP
 Nasdaq
 Wall Street Journal
EN
A Look At O'Reilly Automotive (ORLY) Valuation After 2025 Results And 2026 Guidance Shift Analyst Sentiment
O'Reilly Automotive (ORLY) just released fourth quarter and full year 2025 results alongside fresh 2026 guidance. This gives investors new data on sales, earnings, store growth plans, and expected profitability.
See our latest analysis for O'Reilly Automotive.
O'Reilly Automotive’s 1-day share price return of 0.78% and year to date share price return of 3.43% sit against a softer recent patch, including a 7 day share price return of 3.77% and 90 day share price return of 4.74%. The 5 year total shareholder return of 216.55% points to strong longer term compounding even as recent earnings news and expense concerns appear to have cooled momentum.
If this earnings update has you comparing ideas across retail and beyond, it can be a good time to scan our screener of 23 top founder-led companies for other potential opportunities.
With ORLY trading at US$93.44, an intrinsic value estimate suggesting a premium, and the stock sitting below average analyst targets, the key question for investors is whether there is still a buying opportunity or if the market is already pricing in future growth.
Most Popular Narrative: 15.2% Undervalued
Against the last close at $93.44, the most followed narrative pegs fair value closer to $110.20, framing O'Reilly Automotive as trading at a noticeable discount and putting its long term growth, margins, and cash generation assumptions under the spotlight.
O'Reilly's consistent emphasis on enhancing customer service and operational excellence through training and leadership development is likely to result in higher ticket counts and customer retention, potentially boosting revenue and net earnings.
Curious what kind of revenue growth, margin profile, and earnings multiple are baked into that higher fair value? The narrative leans on steady comp momentum, richer profitability, and a premium P/E that is more commonly associated with faster growing peers. Want to see which specific long term forecasts are doing the heavy lifting in that $110.20 tag?
Result: Fair Value of $110.20 (UNDERVALUED)
Have a read of the narrative in full and understand what's behind the forecasts.
However, that upside story could be challenged if tariff or trade changes raise product costs, or if inflation-driven wage and occupancy expenses squeeze margins more than expected.
Find out about the key risks to this O'Reilly Automotive narrative.
Another View On Valuation
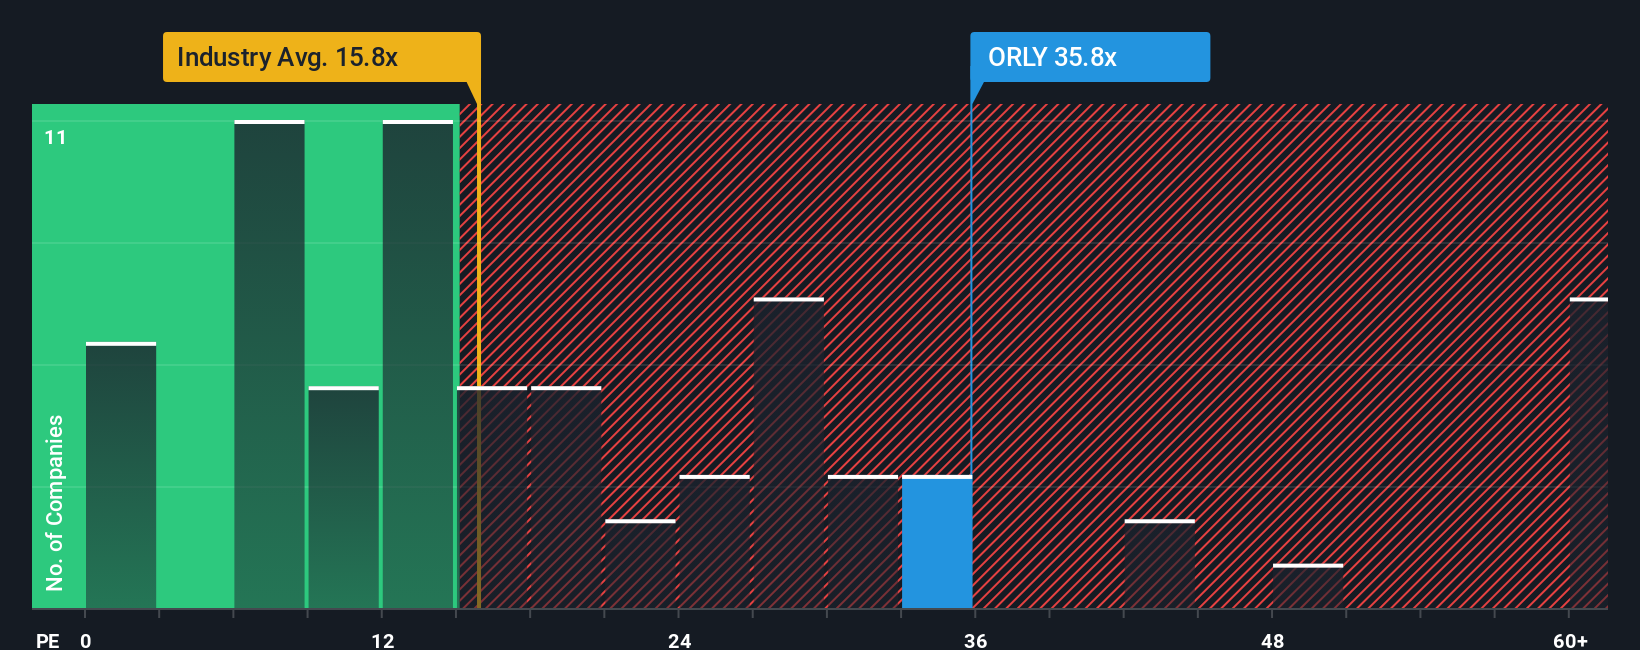
The most followed narrative sees O'Reilly Automotive as 15.2% undervalued, but our P/E based view tells a different story. ORLY trades at 31x earnings, which is higher than the US Specialty Retail average of 20.7x and also well above its fair ratio of 20.1x. That kind of premium can signal quality, but it also leaves less room if expectations cool. Which story do you think the market leans toward over time?
See what the numbers say about this price — find out in our valuation breakdown.
Build Your Own O'Reilly Automotive Narrative
If you see the story differently, or simply want to test your own assumptions against the data, you can build a tailored view in minutes: Do it your way.
A great starting point for your O'Reilly Automotive research is our analysis highlighting 2 key rewards and 3 important warning signs that could impact your investment decision.
Ready for more investment ideas?
If O'Reilly Automotive has sharpened your thinking, do not stop here. Broaden your watchlist with focused stock ideas grounded in fundamentals and clear financial data.
- Target reliability first by scanning companies in our 83 resilient stocks with low risk scores that aim to keep risk scores on the lower side.
- Hunt for quality at a sensible price with our 51 high quality undervalued stocks, built to surface businesses that pair solid fundamentals with potentially attractive pricing.
- Spot potential future standouts early through our screener containing 24 high quality undiscovered gems, where you can review lesser known names backed by financial strength before the crowd pays attention.
This article by Simply Wall St is general in nature. We provide commentary based on historical data and analyst forecasts only using an unbiased methodology and our articles are not intended to be financial advice. It does not constitute a recommendation to buy or sell any stock, and does not take account of your objectives, or your financial situation. We aim to bring you long-term focused analysis driven by fundamental data. Note that our analysis may not factor in the latest price-sensitive company announcements or qualitative material. Simply Wall St has no position in any stocks mentioned.
Have feedback on this article? Concerned about the content? Get in touch with us directly. Alternatively, email editorial-team@simplywallst.com