
- LIVE QUOTES
- LEARN
- HELP
 Nasdaq
 Wall Street Journal
EN
Corebridge Financial Q4 Profit Rebound Tests Bullish Earnings Turnaround Narrative
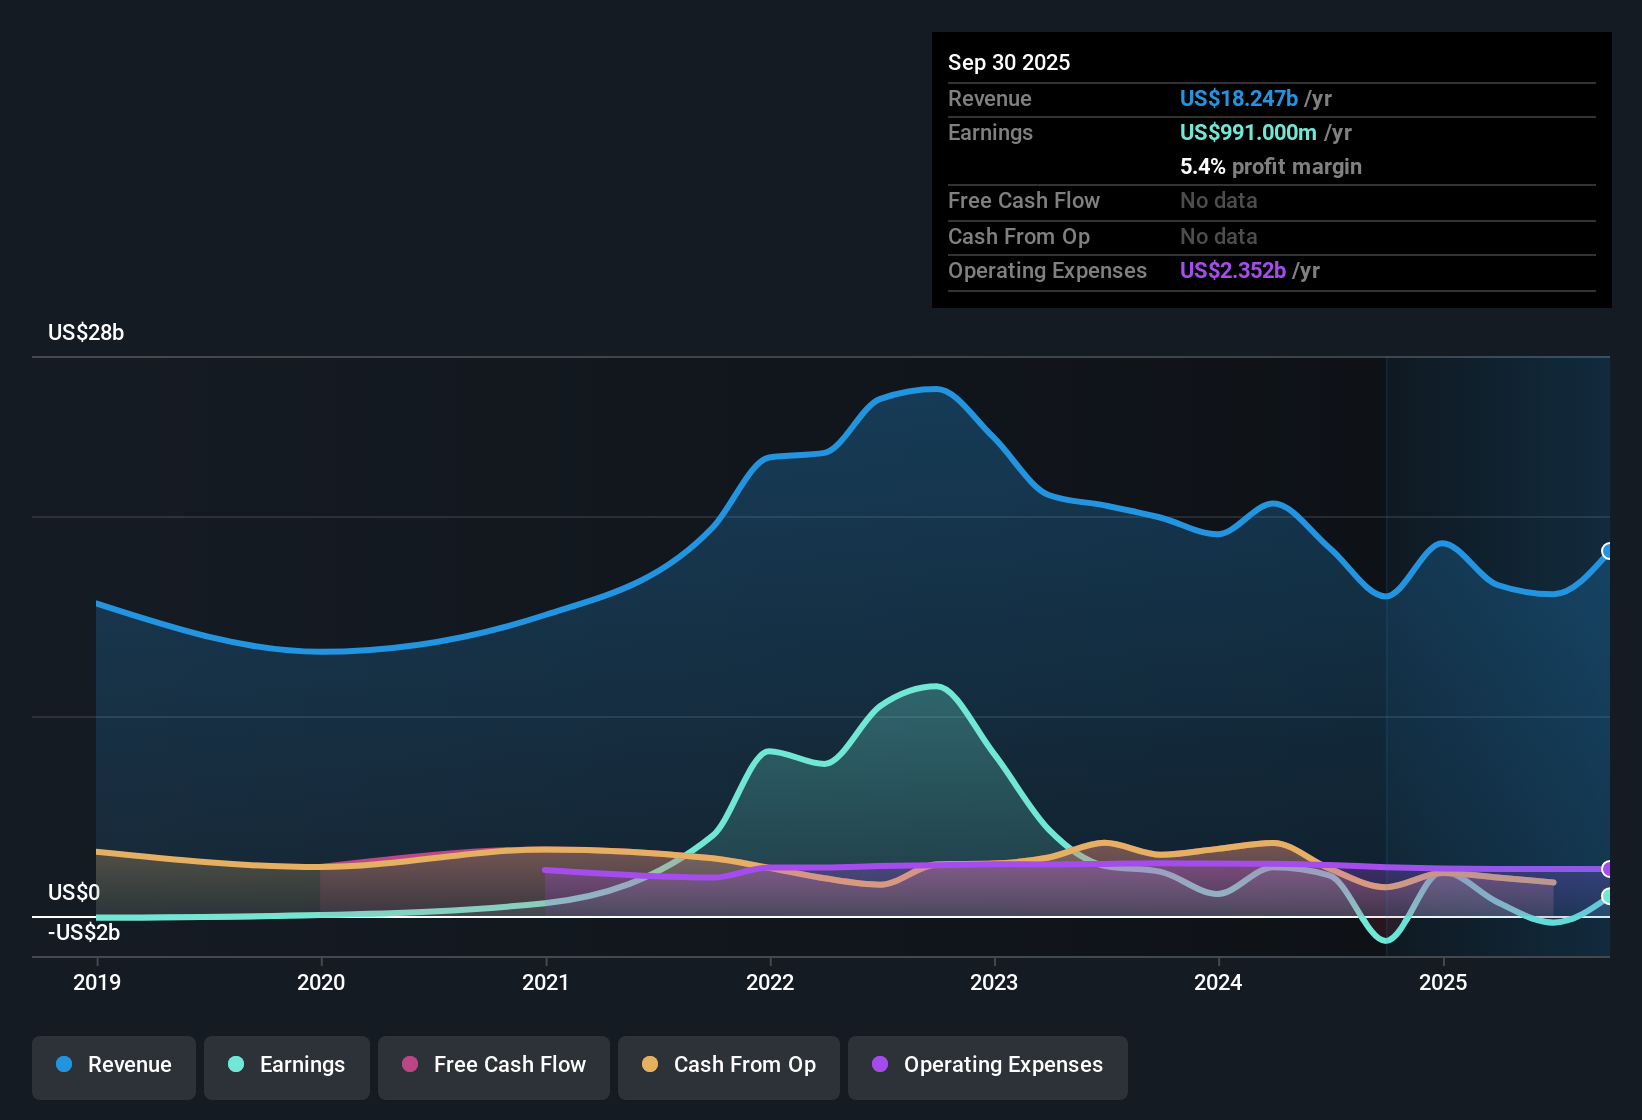
Corebridge Financial FY 2025 Results: Volatile Earnings Against Growing Revenue Base
Corebridge Financial (CRBG) closed out FY 2025 with Q4 revenue of US$6.6b and basic EPS of US$1.60, rounding off a year in which trailing twelve month revenue came in at US$18.6b and basic EPS stood at a loss of US$0.68. The company has seen quarterly revenue range from US$3.2b in Q2 2025 up to US$6.6b in Q4 2025, while basic EPS moved from a loss of US$1.19 in Q1 2025 to US$1.60 in Q4 2025. This highlights sharp swings in profitability that matter for anyone focused on underlying margins.
See our full analysis for Corebridge Financial.With the latest numbers on the table, the next step is to see how this earnings profile lines up with the dominant narratives around Corebridge's growth potential, risk profile, and path back to steadier margins.
See what the community is saying about Corebridge Financial
Loss-Making TTM Despite Strong Q4 Profit
- Even with Q4 2025 net income of US$814 million and basic EPS of US$1.60, the trailing twelve months still show a net loss of US$366 million and basic EPS of US$0.68 loss.
- Consensus narrative talks about improved efficiency and lower expense ratios helping margins. However, the trailing loss and the swing from Q4 2024 net income of US$2.2b to a TTM loss highlight that earnings stability is still a work in progress:
- Q1 and Q2 2025 together produced net losses of about US$1.3b, which offsets the profitable Q3 and Q4 periods.
- This mix of profitable and loss-making quarters challenges the bullish idea that margin improvement is already consistently flowing through to the bottom line.
Revenue Base Around US$18.6b With Slower Forecast Growth
- Trailing twelve month revenue sits at about US$18.6b, and revenue is forecast to grow about 6.9% per year, compared with a 10.3% forecast for the broader US market.
- Supporters of the bullish view point to retirement demand and fee based products as long term drivers. At the same time, the current 6.9% revenue growth forecast and the relatively flat TTM revenue range of US$16.1b to US$18.6b suggest that top line momentum is steadier rather than rapid:
- Quarterly revenue over the last six reported quarters has moved between US$2.9b and US$6.6b, which keeps the scale large but does not yet show a clear acceleration trend in the TTM data.
- This measured revenue outlook contrasts with the stronger forecasted earnings growth of about 40.8% per year, which assumes meaningful margin improvement rather than a big jump in sales.
Unprofitable TTM Against Value Style Pricing
- The shares trade at a P/S of 0.9x versus 1.6x for peers and 2.5x for the US Diversified Financial industry, while the current price of US$31.45 sits well below the US$61.24 DCF fair value and the analyst target of US$37.54, even though the company was loss making over the last year.
- Bears focus on the trailing loss profile and weak dividend cover, and those concerns line up with the data, even with the apparent discount:
- Losses have increased by about 42.9% per year over the past five years and the 3.05% dividend is not well covered by recent earnings, which keeps cash returns under scrutiny.
- The gap between the current price, the DCF fair value of US$61.24 and the US$37.54 analyst target suggests the market is already baking in a material amount of caution around execution on the earnings turnaround.
Next Steps
To see how these results tie into long-term growth, risks, and valuation, check out the full range of community narratives for Corebridge Financial on Simply Wall St. Add the company to your watchlist or portfolio so you'll be alerted when the story evolves.
See something different in the figures? Take a couple of minutes to put that view into a clear storyline that reflects your own thesis, Do it your way
A great starting point for your Corebridge Financial research is our analysis highlighting 3 key rewards and 1 important warning sign that could impact your investment decision.
See What Else Is Out There
Corebridge is working through an unprofitable trailing twelve month period, weak dividend cover, and uneven quarterly earnings, despite a large revenue base and apparent valuation discount.
If those patchy profits and dividend concerns make you cautious, you could instead look at steadier income candidates by checking out our 14 dividend fortresses right now.
This article by Simply Wall St is general in nature. We provide commentary based on historical data and analyst forecasts only using an unbiased methodology and our articles are not intended to be financial advice. It does not constitute a recommendation to buy or sell any stock, and does not take account of your objectives, or your financial situation. We aim to bring you long-term focused analysis driven by fundamental data. Note that our analysis may not factor in the latest price-sensitive company announcements or qualitative material. Simply Wall St has no position in any stocks mentioned.
Have feedback on this article? Concerned about the content? Get in touch with us directly. Alternatively, email editorial-team@simplywallst.com