
- LIVE QUOTES
- LEARN
- HELP
 Nasdaq
 Wall Street Journal
EN
A Look At Gold.com (GOLD) Valuation After A Strong Multi‑Period Share Price Rally
Recent performance snapshot for Gold.com (GOLD)
Gold.com (GOLD) has drawn fresh attention after a strong recent run, with the share price at $55.32 and double digit returns over the past week, month and past 3 months catching investor interest.
See our latest analysis for Gold.com.
The recent 1 day share price return of 9.87% and 30 day share price return of 41.85% sit alongside a 1 year total shareholder return of 98.57%. This points to strong momentum that has built over both shorter and longer horizons as investors reassess growth prospects and risk around the current US$55.32 level.
If this move in Gold.com has you looking at other precious metals names, our list of 21 elite gold producer stocks is a straightforward way to see what else is gaining attention in the sector.
With the share price already up sharply and sitting at US$55.32, the key question is whether Gold.com is still trading below what its fundamentals might justify, or if the market is already pricing in future growth.
Most Popular Narrative: 17.1% Undervalued
The most followed narrative currently points to a fair value of $66.75 for Gold.com versus the last close at $55.32, framing the recent rally in a valuation context.
The completed upgrade of the Las Vegas AMGL facility and ongoing automation/digitalization in logistics and retail are expected to lower cost structures, enable scalable growth, and improve net margins as volumes recover.
Curious what has to happen for Gold.com to reach that fair value? The narrative leans heavily on richer margins, faster top line progress, and a higher earnings multiple working together. The full write up explains how those pieces fit into the long term model.
Result: Fair Value of $66.75 (UNDERVALUED)
Have a read of the narrative in full and understand what's behind the forecasts.
However, there are still pressure points to watch, including rising SG&A and reliance on acquisitions instead of organic demand to support revenue and margins.
Find out about the key risks to this Gold.com narrative.
Another View: Earnings Multiple Flags a Rich Price
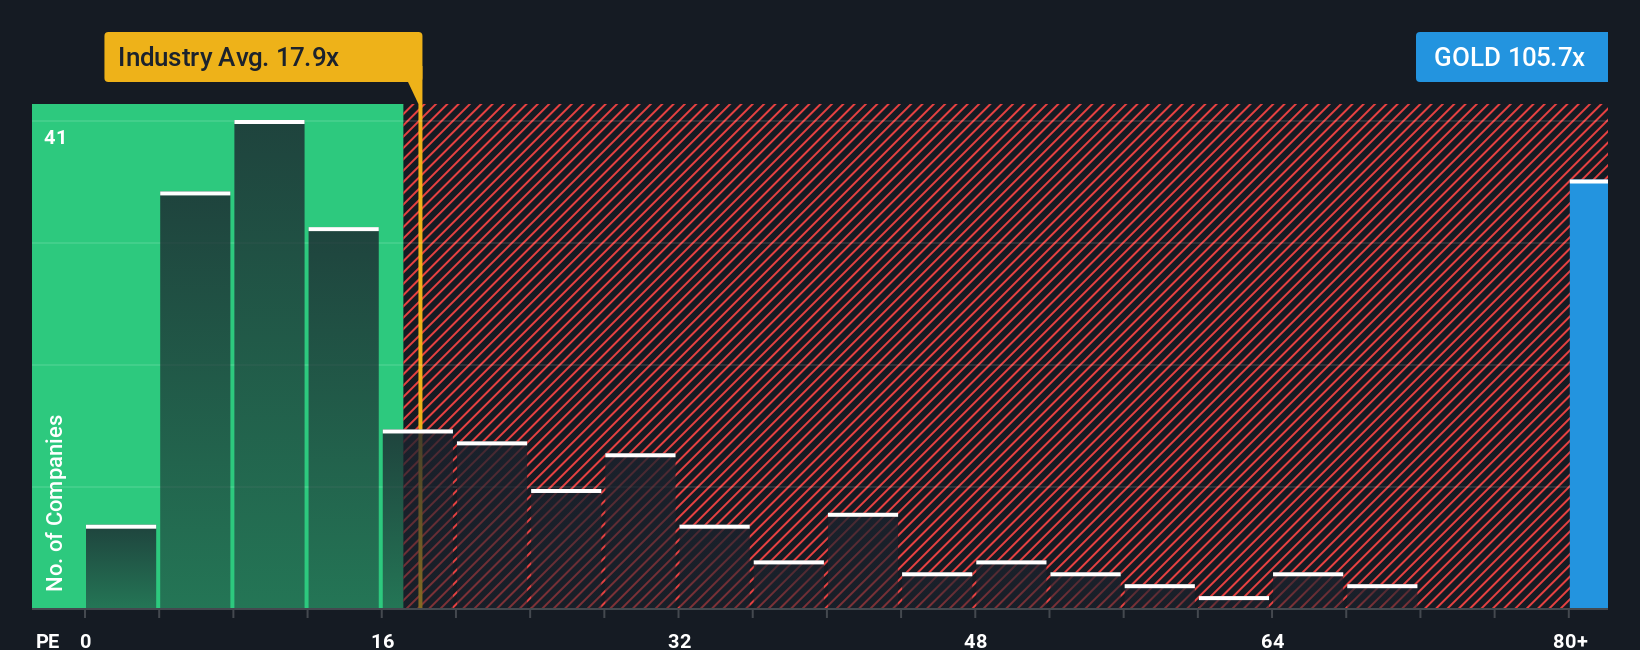
That 17.1% gap to the $66.75 fair value is one story, but the current P/E of 112.2x tells a very different one. It sits far above the 13.8x peer average, the 17.7x industry average, and even the 24.9x fair ratio. For you, that raises a simple question: how much optimism is already baked in?
See what the numbers say about this price — find out in our valuation breakdown.
Build Your Own Gold.com Narrative
If you see the numbers differently or simply want to test your own assumptions, you can build a personalized Gold.com view in just a few minutes, starting with Do it your way.
A great starting point for your Gold.com research is our analysis highlighting 1 key reward and 4 important warning signs that could impact your investment decision.
Looking for more investment ideas beyond Gold.com?
Gold.com might be front of mind today, but you do not want your portfolio to hinge on a single story when other opportunities are waiting for attention.
- Spot potential bargains quickly by scanning our list of 52 high quality undervalued stocks that pair quality fundamentals with prices that may not fully reflect them.
- Strengthen your portfolio’s resilience by reviewing companies in the solid balance sheet and fundamentals stocks screener (45 results) that emphasize financial health and stability.
- Get ahead of the crowd by checking our screener containing 24 high quality undiscovered gems that highlight quality businesses which may not yet be widely followed.
This article by Simply Wall St is general in nature. We provide commentary based on historical data and analyst forecasts only using an unbiased methodology and our articles are not intended to be financial advice. It does not constitute a recommendation to buy or sell any stock, and does not take account of your objectives, or your financial situation. We aim to bring you long-term focused analysis driven by fundamental data. Note that our analysis may not factor in the latest price-sensitive company announcements or qualitative material. Simply Wall St has no position in any stocks mentioned.
Have feedback on this article? Concerned about the content? Get in touch with us directly. Alternatively, email editorial-team@simplywallst.com