
- LIVE QUOTES
- LEARN
- HELP
 Nasdaq
 Wall Street Journal
EN
Is It Time To Reassess Viasat (VSAT) After Its 266.4% One-Year Surge?
- If you are wondering whether Viasat's share price still offers value after its recent run, this article walks through what the current market price might be implying.
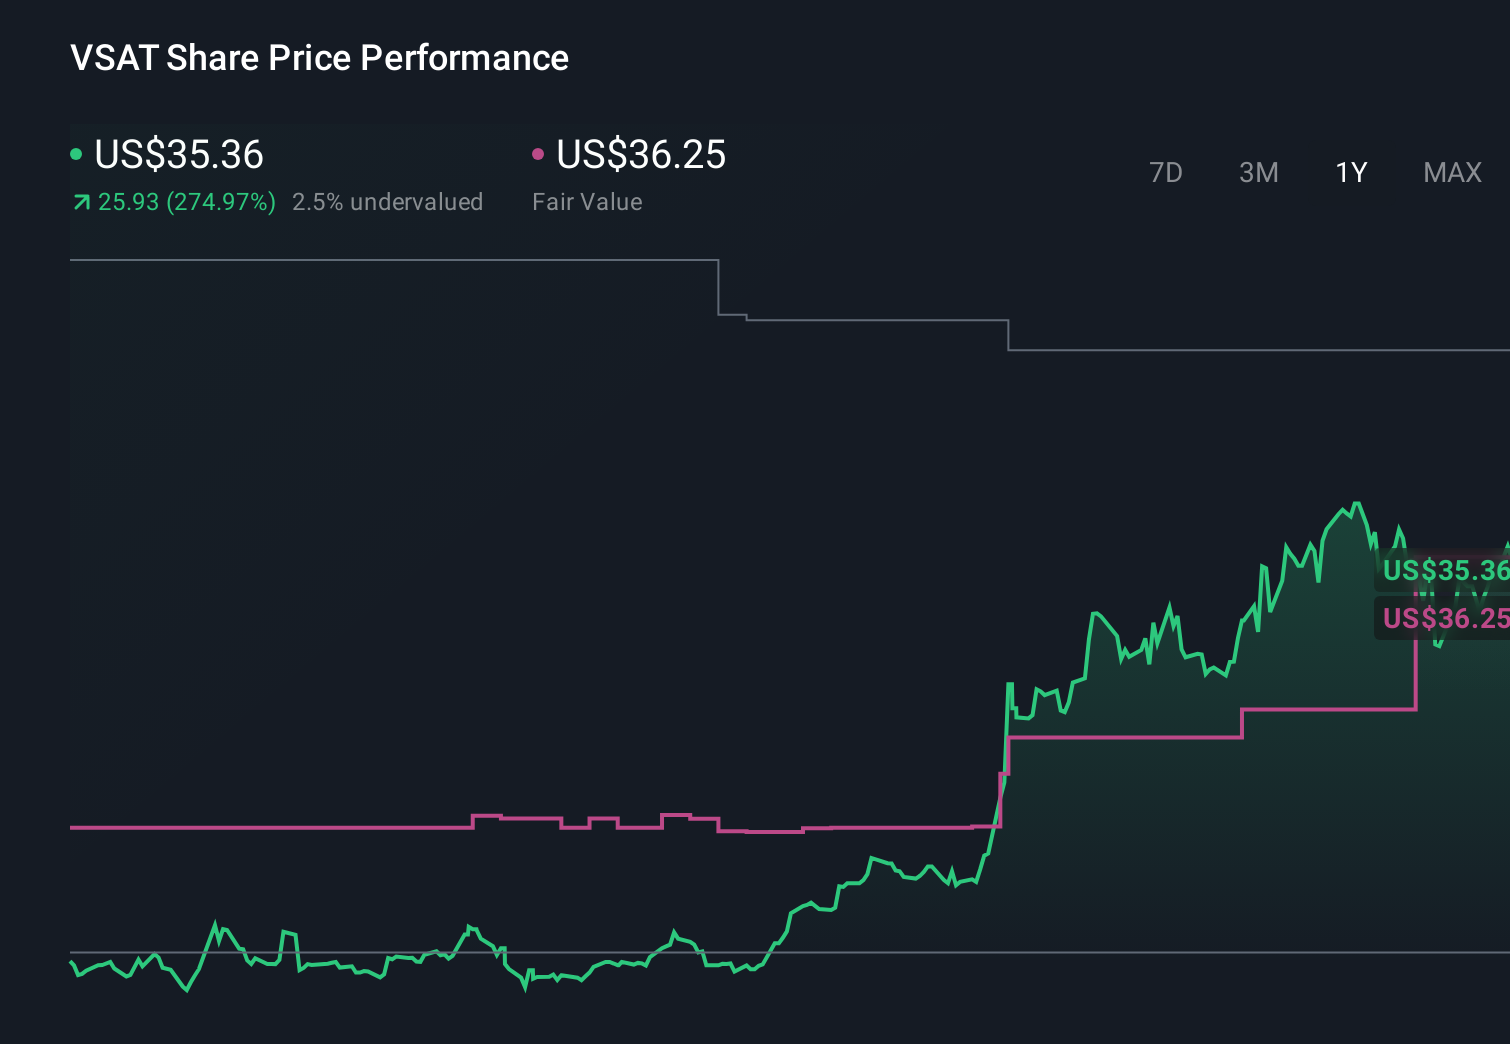
- Viasat closed at US$41.70, with returns of 10.8% year to date, 266.4% over the past year, 35.4% over three years, 2.2% over the past month and a 7.7% decline over the last week. This hints that sentiment has been shifting over different time frames.
- Recent news around Viasat has focused on its position in satellite communications and connectivity. This helps explain why investors are paying closer attention to the stock and provides useful context when you are weighing up whether recent price moves are driven more by changing expectations or by underlying business developments.
- On our checklist of six valuation tests, Viasat scores 5 out of 6, giving it a valuation score of 5. Next we will look at how different valuation approaches line up with that score and why there may be an even better way to think about value by the end of this article.
Approach 1: Viasat Discounted Cash Flow (DCF) Analysis
A Discounted Cash Flow, or DCF, model takes projections of a company’s future cash flows and discounts them back to today’s value using a required rate of return. It is a way of asking what those future cash flows are worth in today’s dollars.
For Viasat, the model used is a 2 Stage Free Cash Flow to Equity approach, based on cash flows in $. The latest twelve month free cash flow is about $289.7 million. Analysts provide explicit forecasts for the next few years, and beyond that Simply Wall St extrapolates the path of free cash flow. In this model, the projected free cash flow for 2035 is $1,192.2 million, or about $1.2b.
Bringing all those projected cash flows back to today gives an estimated intrinsic value of $73.10 per share. Compared with the recent share price of $41.70, the DCF implies the stock is around 43.0% undervalued based on these assumptions and projections.
Result: UNDERVALUED
Our Discounted Cash Flow (DCF) analysis suggests Viasat is undervalued by 43.0%. Track this in your watchlist or portfolio, or discover 52 more high quality undervalued stocks.
Approach 2: Viasat Price vs Sales
For companies where earnings are limited or volatile, P/S can be a useful way to think about valuation because it focuses on what investors are paying for each dollar of revenue rather than profit. Investors usually accept a higher or lower “normal” P/S depending on how they see revenue growth prospects and risk, with faster growth and lower perceived risk often justifying a higher multiple.
Viasat currently trades on a P/S of 1.23x. That sits below both the Communications industry average of 1.99x and the peer group average of 5.14x, which on a simple comparison suggests the market is attaching a lower value to each dollar of Viasat’s sales than to many peers.
Simply Wall St’s Fair Ratio for Viasat is 1.90x. This is a proprietary view of what the P/S could be given factors such as Viasat’s earnings profile, industry, profit margins, market cap and specific risks. It aims to be more tailored than a straight peer or industry comparison because those can ignore differences in growth, risk and profitability. Comparing the Fair Ratio of 1.90x with the current P/S of 1.23x, Viasat screens as undervalued on this measure.
Result: UNDERVALUED

P/S ratios tell one story, but what if the real opportunity lies elsewhere? Start investing in legacies, not executives. Discover our 22 top founder-led companies.
Upgrade Your Decision Making: Choose your Viasat Narrative
Earlier we mentioned that there is an even better way to understand valuation, so let us introduce you to Narratives, which are simply your story about a company joined to your numbers, like your fair value and your estimates for future revenue, earnings and margins.
A Narrative on Simply Wall St connects three things: what you think is happening with the business, the forecast that follows from that view, and the fair value that drops out of those assumptions.
You can create and compare Narratives on the Community page. There, millions of investors share how they see a stock and then line that up against today’s price to decide whether it looks closer to a buy, a hold or a sell for them.
Narratives update automatically when fresh information such as news or earnings is added to the platform. With Viasat you might see one Narrative that assumes a relatively high fair value based on stronger long term revenue and margin assumptions, while another keeps fair value much lower because it assumes slower growth and more conservative profitability.
Do you think there's more to the story for Viasat? Head over to our Community to see what others are saying!
This article by Simply Wall St is general in nature. We provide commentary based on historical data and analyst forecasts only using an unbiased methodology and our articles are not intended to be financial advice. It does not constitute a recommendation to buy or sell any stock, and does not take account of your objectives, or your financial situation. We aim to bring you long-term focused analysis driven by fundamental data. Note that our analysis may not factor in the latest price-sensitive company announcements or qualitative material. Simply Wall St has no position in any stocks mentioned.
Have feedback on this article? Concerned about the content? Get in touch with us directly. Alternatively, email editorial-team@simplywallst.com