
- LIVE QUOTES
- LEARN
- HELP
 Nasdaq
 Wall Street Journal
EN
Assessing Sterling Infrastructure (STRL) Valuation After A Strong Run In Share Price Momentum
Stock move and recent performance context
Sterling Infrastructure (STRL) has drawn fresh attention after its share price closed at $401.29, with recent returns of 9.9% over the past day, 12.1% over the past week, and 30.2% over the past month.
See our latest analysis for Sterling Infrastructure.
That sharp 30.2% 1 month share price return sits within a much bigger move, with the year to date share price return at 25.7% and the 1 year total shareholder return at 168%, so momentum currently looks strong rather than fading.
If Sterling Infrastructure's run has you thinking about other infrastructure related themes, you might like to scan our list of 24 power grid technology and infrastructure stocks as a starting point for ideas.
With shares at $401.29, a 10.5% gap to the average analyst price target and one valuation model implying a premium, the real question is whether Sterling Infrastructure is still mispriced or if markets are already accounting for future growth.
Most Popular Narrative: 9.5% Undervalued
With Sterling Infrastructure last closing at $401.29 against a narrative fair value of $443.25, the current setup hinges on how durable its project pipeline really is.
Current valuation appears to assume continued outsized E-Infrastructure revenue and margin growth, heavily reliant on unprecedented levels of data center construction and mega-project activity. If hyperscale data center CapEx or manufacturing mega-project awards slow due to macro or tech sector shifts, revenue and earnings could fall short of expectations.
Want to see what is baked into that fair value gap? The narrative leans on specific revenue and margin paths, plus a rich future earnings multiple. Curious which assumptions really move the model and how sensitive the outcome is if they shift?
Result: Fair Value of $443.25 (UNDERVALUED)
Have a read of the narrative in full and understand what's behind the forecasts.
However, that story can change quickly if mega-project awards slow or profit margins land below current expectations. This could challenge the higher future P/E implied here.
Find out about the key risks to this Sterling Infrastructure narrative.
Another angle on valuation
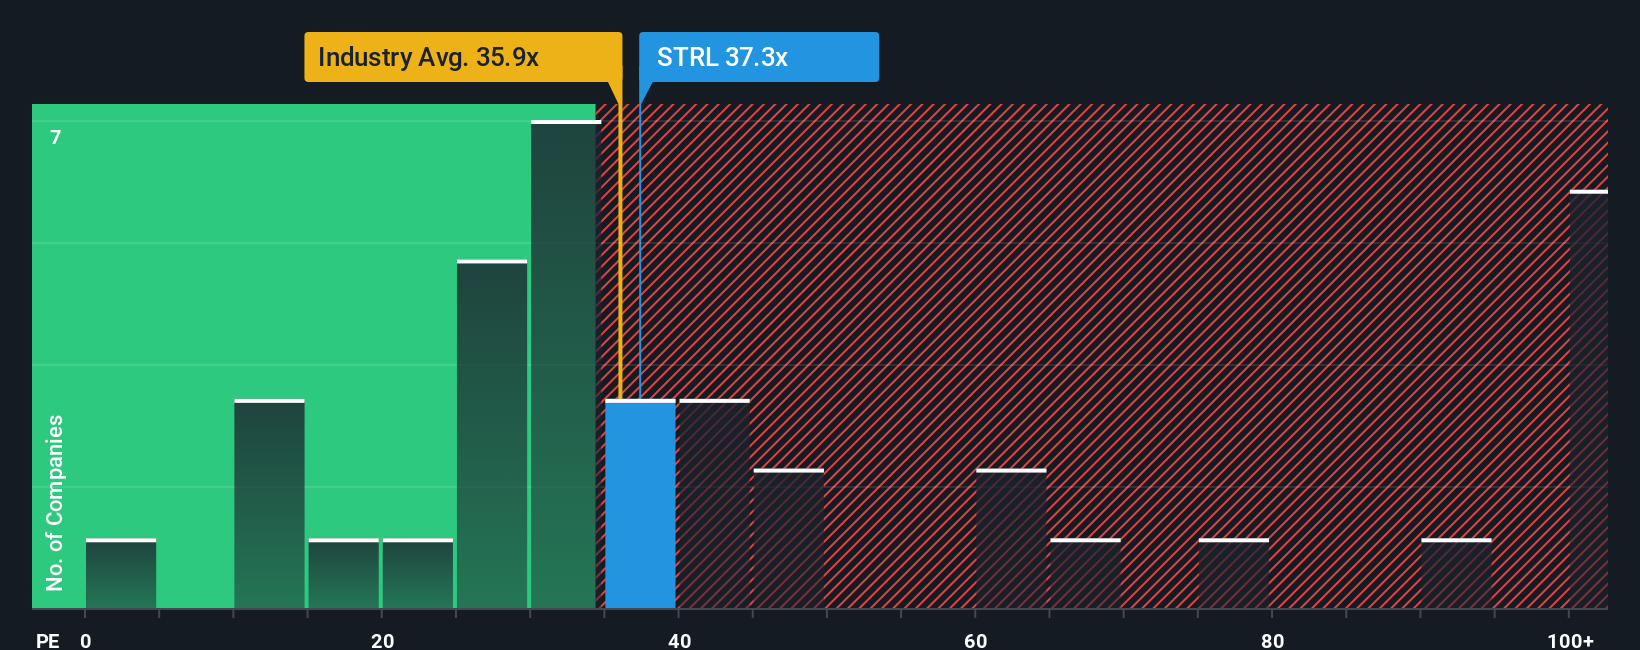
The narrative fair value points to Sterling Infrastructure trading at a 9.5% discount, but the earnings multiple tells a different story. At a P/E of 39x, the shares sit above both the company’s own fair ratio of 36.5x and the US Construction industry average of 38.3x, as well as peers at 29.7x. That kind of premium can signal confidence in execution, or it can leave less room for error if growth expectations cool. Which side of that tradeoff do you think fits your view?
See what the numbers say about this price — find out in our valuation breakdown.
Build Your Own Sterling Infrastructure Narrative
If you look at the numbers and reach a different conclusion, or simply prefer to test the assumptions yourself, you can build a custom view in just a few minutes, starting with Do it your way.
A great starting point for your Sterling Infrastructure research is our analysis highlighting 2 key rewards and 1 important warning sign that could impact your investment decision.
Looking for more investment ideas?
If Sterling Infrastructure has sharpened your focus, do not stop here. Use the screeners below to stress test your thinking and spot opportunities you might otherwise miss.
- Pinpoint quality at a discount by checking our list of 52 high quality undervalued stocks that combine fundamentals with pricing that could interest disciplined investors.
- Protect against surprises by scanning 82 resilient stocks with low risk scores that score well on stability, so you can focus on ideas that better fit a cautious approach.
- Get ahead of the crowd by reviewing our screener containing 24 high quality undiscovered gems before they hit more radars and are harder to ignore.
This article by Simply Wall St is general in nature. We provide commentary based on historical data and analyst forecasts only using an unbiased methodology and our articles are not intended to be financial advice. It does not constitute a recommendation to buy or sell any stock, and does not take account of your objectives, or your financial situation. We aim to bring you long-term focused analysis driven by fundamental data. Note that our analysis may not factor in the latest price-sensitive company announcements or qualitative material. Simply Wall St has no position in any stocks mentioned.
Have feedback on this article? Concerned about the content? Get in touch with us directly. Alternatively, email editorial-team@simplywallst.com