
- LIVE QUOTES
- LEARN
- HELP
 Nasdaq
 Wall Street Journal
EN
Is Azenta (AZTA) Now Pricing In Too Much Pessimism After Steep Share Price Slide?
- If you are wondering whether Azenta's current share price reflects its true worth, you are not alone. This article is built to help you connect the recent share moves with what the underlying valuation is saying.
- The stock closed at US$28.72, with returns of a 26.1% decline over 7 days, 24.3% decline over 30 days, 14.0% decline year to date, 45.1% decline over 1 year, 35.9% decline over 3 years and 68.3% decline over 5 years. These figures may change how investors think about both risk and potential reward.
- Recent news coverage around Azenta has focused on its role in life sciences tools and services and how investors are weighing that exposure against broader sector sentiment. This backdrop helps explain why some shareholders are rethinking their time horizon while others are starting to look more closely at the stock.
- On our valuation checklist Azenta scores a 4 out of 6. This reflects areas where the shares look inexpensive on certain metrics and less so on others. Next we will compare different valuation approaches to see what they suggest about the current price, then finish with a framework that can help you judge whether those numbers really fit your own view of the company.
Find out why Azenta's -45.1% return over the last year is lagging behind its peers.
Approach 1: Azenta Discounted Cash Flow (DCF) Analysis
A Discounted Cash Flow, or DCF, model estimates what a business could be worth today by projecting its future cash flows and discounting them back to the present. For Azenta, the model used is a 2 Stage Free Cash Flow to Equity approach, based on cash flow projections rather than accounting earnings.
Azenta last reported free cash flow of about $28.9 million, and analysts plus extrapolated estimates point to free cash flow of $73 million in 2028. Beyond the analyst horizon, Simply Wall St extends the projections out to 2035, with each future cash flow discounted back into today’s dollars to reflect risk and the time value of money.
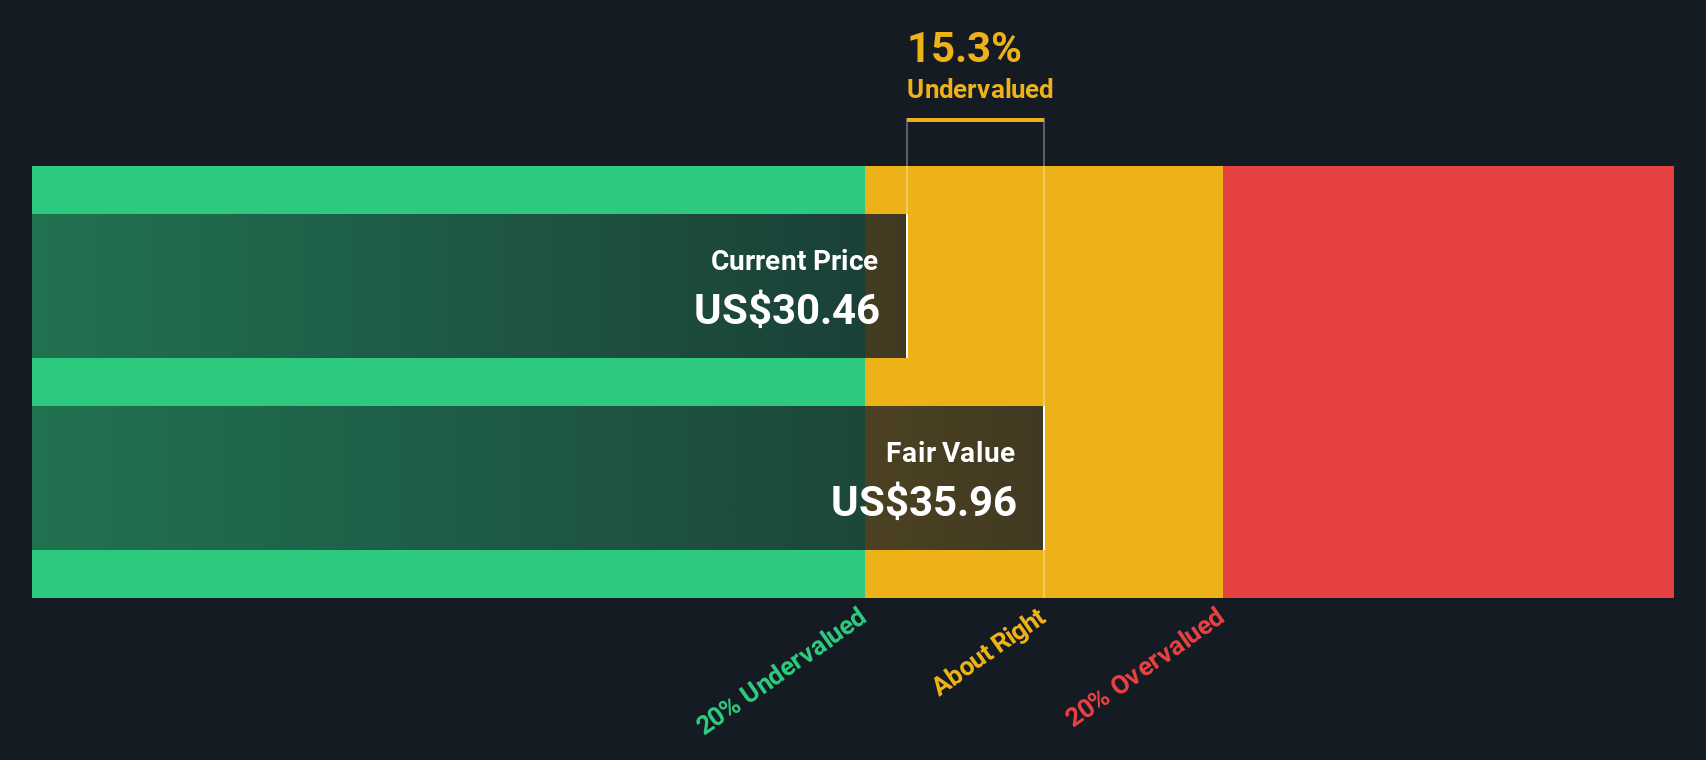
Bringing all of those discounted cash flows together gives an estimated intrinsic value of US$43.47 per share, compared to the recent share price of US$28.72. On this DCF view, the shares trade at a 33.9% discount, which indicates Azenta is currently undervalued relative to these cash flow assumptions.
Result: UNDERVALUED
Our Discounted Cash Flow (DCF) analysis suggests Azenta is undervalued by 33.9%. Track this in your watchlist or portfolio, or discover 52 more high quality undervalued stocks.
Approach 2: Azenta Price vs Earnings
For a profitable business, the P/E ratio is a useful shorthand for how much investors are paying for each dollar of earnings. It is simple to compare across companies in the same sector and it ties directly to what many shareholders focus on, earnings per share.
What counts as a reasonable P/E depends on how quickly earnings are expected to grow and how risky those earnings are. Higher growth and lower perceived risk can support a higher multiple, while slower growth or higher uncertainty usually points to a lower, more conservative range.
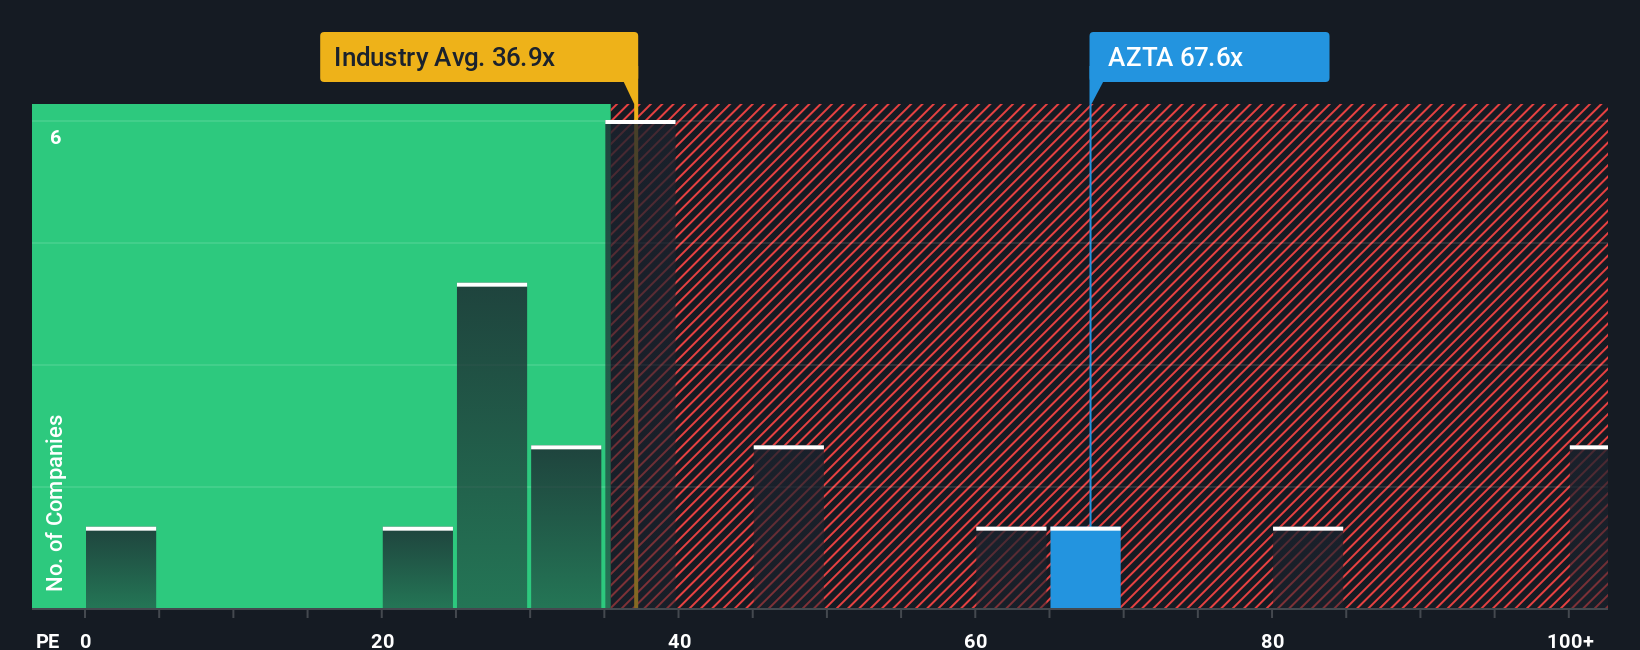
Azenta currently trades on a P/E of 50.22x, compared with the Life Sciences industry average of 36.54x and a peer average of 66.43x. Simply Wall St also calculates a proprietary Fair Ratio of 22.46x for Azenta. This Fair Ratio is designed to be more tailored than a simple peer or industry comparison because it incorporates factors such as earnings growth, risk profile, profit margins, industry classification and market cap. On this view, Azenta’s current P/E sits well above its Fair Ratio, which suggests the shares look expensive relative to these fundamentals.
Result: OVERVALUED
P/E ratios tell one story, but what if the real opportunity lies elsewhere? Start investing in legacies, not executives. Discover our 22 top founder-led companies.
Upgrade Your Decision Making: Choose your Azenta Narrative
Earlier we mentioned that there is an even better way to understand valuation, so let us introduce you to Narratives, which are simply your story about a company linked directly to your fair value, revenue, earnings and margin estimates.
On Simply Wall St, Narratives live in the Community page and let you turn your view of Azenta into a clear forecast and a fair value. This means you can easily compare that fair value with the current share price to help decide whether the stock looks appealing or not for you.
Because Narratives are connected to live data, they update when new earnings, news or other information is added. As a result, your story, your forecast and your fair value stay aligned without you rebuilding everything from scratch.
For example, one Azenta Narrative in the Community might assume relatively modest revenue growth and cautious margins that support a lower fair value. Another might assume stronger growth and higher margins that support a higher fair value. This gives you a clear view of how different assumptions lead to different conclusions about the same stock.
Do you think there's more to the story for Azenta? Head over to our Community to see what others are saying!

This article by Simply Wall St is general in nature. We provide commentary based on historical data and analyst forecasts only using an unbiased methodology and our articles are not intended to be financial advice. It does not constitute a recommendation to buy or sell any stock, and does not take account of your objectives, or your financial situation. We aim to bring you long-term focused analysis driven by fundamental data. Note that our analysis may not factor in the latest price-sensitive company announcements or qualitative material. Simply Wall St has no position in any stocks mentioned.
Have feedback on this article? Concerned about the content? Get in touch with us directly. Alternatively, email editorial-team@simplywallst.com