
- LIVE QUOTES
- LEARN
- HELP
 Nasdaq
 Wall Street Journal
EN
Is Broadridge (BR) Turning Recurring Revenue And CQG Deal Into A Durable Competitive Advantage?
- Broadridge Financial Solutions recently reported past second-quarter results showing sales of US$1,713.9 million and net income of US$284.6 million, alongside raising its full-year adjusted EPS growth outlook and advancing acquisitions such as CQG to broaden its trading and digital capabilities.
- The company’s near-monopoly in U.S. investor communications, expanding digital asset initiatives, and long-running buyback program underline how its scale and technology focus shape its competitive position.
- With this backdrop and recent earnings guidance increase, we’ll explore how Broadridge’s recurring revenue strength influences its investment narrative.
Rare earth metals are an input to most high-tech devices, military and defence systems and electric vehicles. The global race is on to secure supply of these critical minerals. Beat the pack to uncover the 29 best rare earth metal stocks of the very few that mine this essential strategic resource.
What Is Broadridge Financial Solutions' Investment Narrative?
To own Broadridge, you need to be comfortable backing a scale financial utility that leans heavily on recurring revenues, entrenched customer relationships and steady capital returns rather than rapid growth. The latest quarter, with US$1,713.9 million in sales and US$284.6 million in net income, reinforced that earnings power and supported management’s decision to lift its full‑year adjusted EPS growth outlook. The CQG acquisition and broader push into tokenization and digital trading add new product avenues, but they also raise execution and integration questions at a time when the share price has fallen sharply and analyst targets still sit well above current levels. The completed buyback program removes a long‑running source of support, so near‑term catalysts now lean more on consistent recurring revenue trends and successful delivery on new technology initiatives.
However, one risk in particular could matter more than the recent earnings beat. Despite retreating, Broadridge Financial Solutions' shares might still be trading 44% above their fair value. Discover the potential downside here.Exploring Other Perspectives
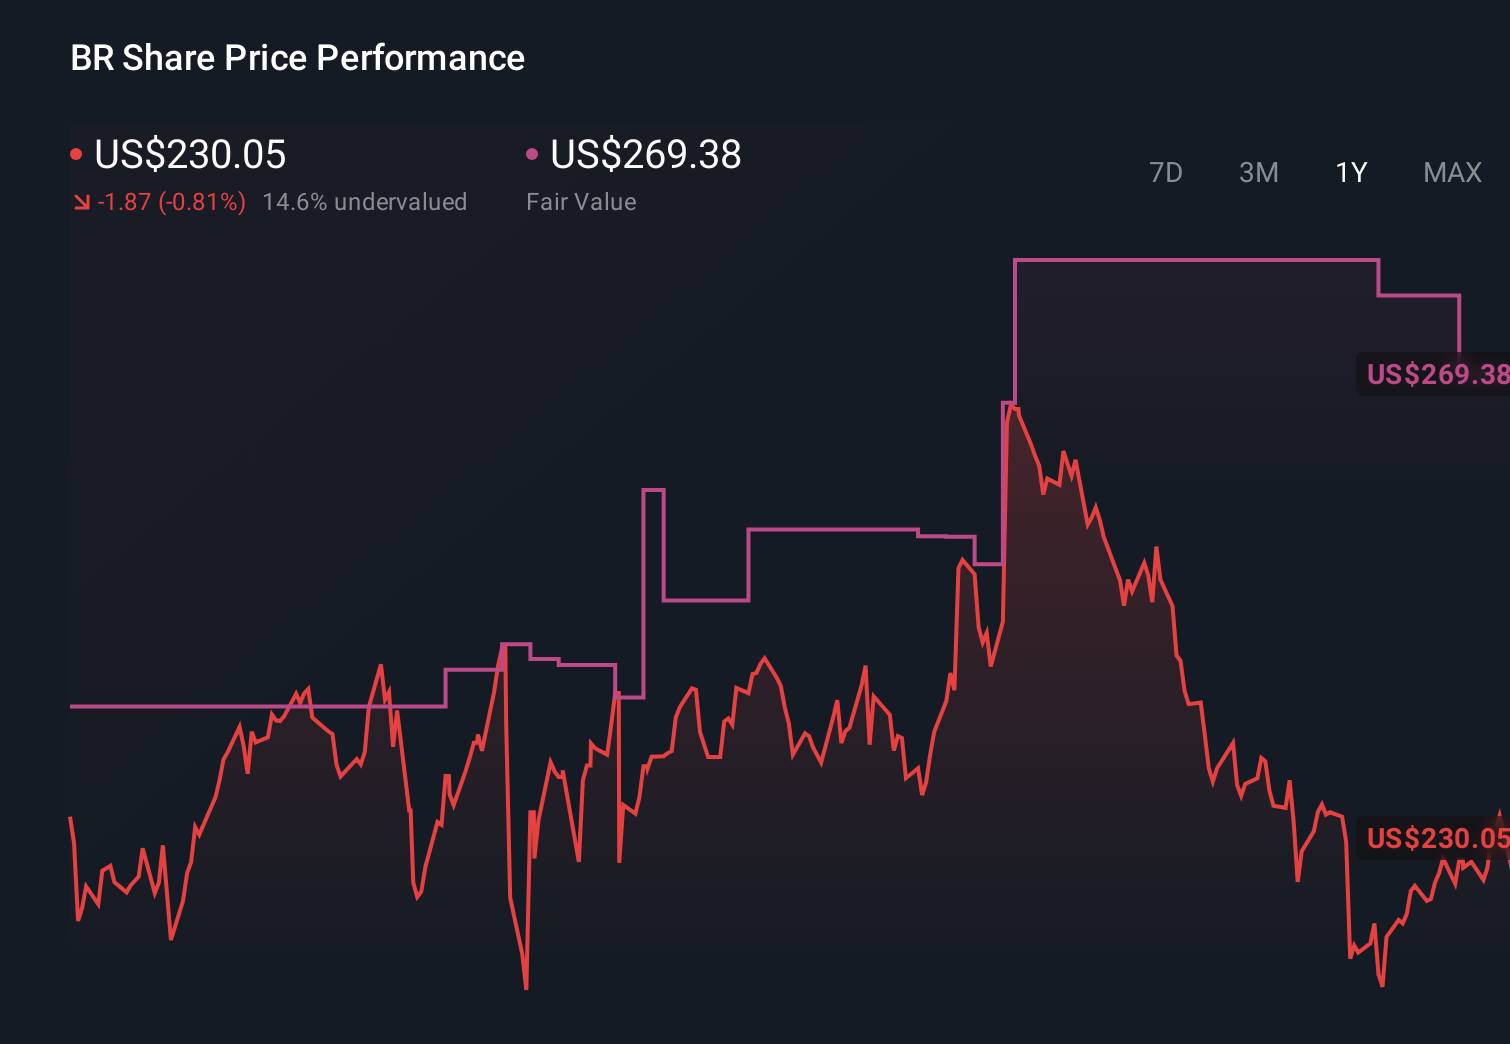
Three Simply Wall St Community fair value estimates cluster between about US$267.88 and US$327.59 per share, well above recent trading. Against that optimism, Broadridge’s high debt and buyback completion could influence how its cash generation supports future growth, so it is worth comparing several viewpoints before forming your own stance.
Explore 3 other fair value estimates on Broadridge Financial Solutions - why the stock might be worth as much as 80% more than the current price!
Build Your Own Broadridge Financial Solutions Narrative
Disagree with this assessment? Create your own narrative in under 3 minutes - extraordinary investment returns rarely come from following the herd.
- A great starting point for your Broadridge Financial Solutions research is our analysis highlighting 5 key rewards and 2 important warning signs that could impact your investment decision.
- Our free Broadridge Financial Solutions research report provides a comprehensive fundamental analysis summarized in a single visual - the Snowflake - making it easy to evaluate Broadridge Financial Solutions' overall financial health at a glance.
No Opportunity In Broadridge Financial Solutions?
These stocks are moving-our analysis flagged them today. Act fast before the price catches up:
- Uncover the next big thing with 24 elite penny stocks that balance risk and reward.
- The best AI stocks today may lie beyond giants like Nvidia and Microsoft. Find the next big opportunity with these 30 smaller AI-focused companies with strong growth potential through early-stage innovation in machine learning, automation, and data intelligence that could fund your retirement.
- We've uncovered the 14 dividend fortresses yielding 5%+ that don't just survive market storms, but thrive in them.
This article by Simply Wall St is general in nature. We provide commentary based on historical data and analyst forecasts only using an unbiased methodology and our articles are not intended to be financial advice. It does not constitute a recommendation to buy or sell any stock, and does not take account of your objectives, or your financial situation. We aim to bring you long-term focused analysis driven by fundamental data. Note that our analysis may not factor in the latest price-sensitive company announcements or qualitative material. Simply Wall St has no position in any stocks mentioned.
Have feedback on this article? Concerned about the content? Get in touch with us directly. Alternatively, email editorial-team@simplywallst.com