
- LIVE QUOTES
- LEARN
- HELP


EN
Is CorVel (CRVL) Now Attractively Priced After Recent Share Price Slide
- If you are wondering whether CorVel's current share price reflects its true worth, you are not alone. This article is set up to help you connect the recent moves in the stock with what the numbers say about value.
- CorVel's share price last closed at US$48.67, after a 7 day return of 30.1% decline, a 30 day return of 31.9% decline, a year to date return of 26.0% decline, a 1 year return of 58.1% decline, a 3 year return of 18.8% decline, and a 5 year return of 43.2% gain.
- These moves sit against a backdrop of ongoing interest in healthcare and insurance related services, where investors often focus on how efficiently companies manage costs and claims. Recent coverage has continued to highlight CorVel's role in managed care and claims management, giving context for why the market might be reassessing how it prices the stock.
- On our valuation framework, CorVel scores 4 out of 6 for value, as shown by our valuation score. Next we will walk through what that means across different valuation methods, before finishing with a broader way to think about CorVel's value that goes beyond the usual ratios.
Find out why CorVel's -58.1% return over the last year is lagging behind its peers.
Approach 1: CorVel Discounted Cash Flow (DCF) Analysis
A Discounted Cash Flow, or DCF, model estimates what a business could be worth by projecting future cash flows and discounting them back to today using a required rate of return. It focuses on the cash that could be available to shareholders rather than short term earnings swings.
For CorVel, the model uses last twelve month Free Cash Flow of about $109.7 million and a 2 Stage Free Cash Flow to Equity framework. Simply Wall St has projected annual Free Cash Flow out to 2035, with estimates such as $130.2 million in 2026 and $243.0 million in 2035. It then discounts each of those figures back to today using its cash flow projections approach.
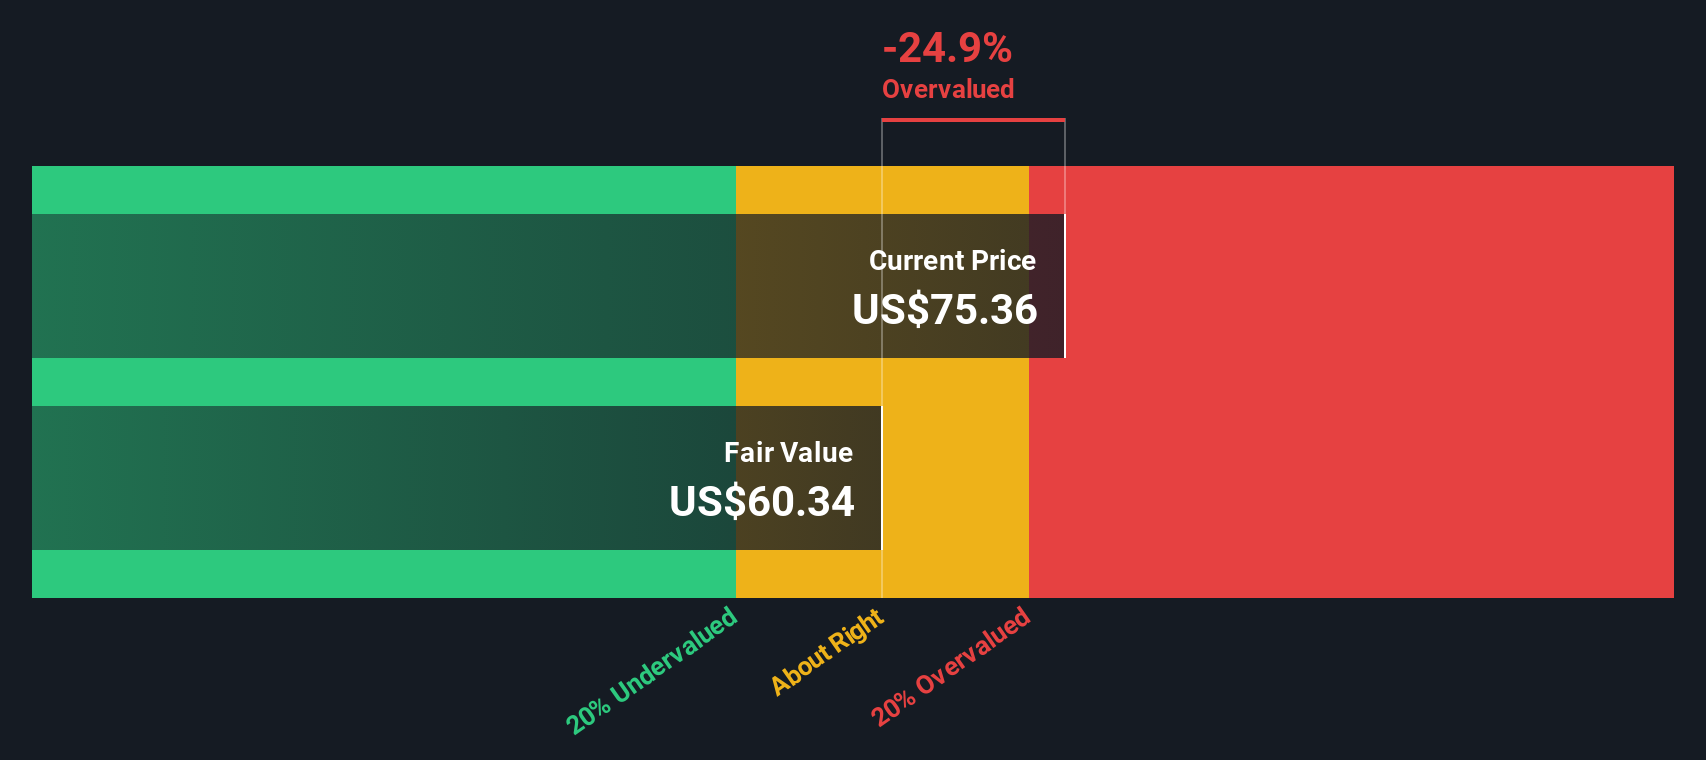
Putting all of that together, the DCF model arrives at an intrinsic value of about $95.76 per share. Compared with the recent share price of $48.67, this implies the stock is 49.2% undervalued on this method.
Result: UNDERVALUED
Our Discounted Cash Flow (DCF) analysis suggests CorVel is undervalued by 49.2%. Track this in your watchlist or portfolio, or discover 52 more high quality undervalued stocks.
Approach 2: CorVel Price vs Earnings
For a profitable company like CorVel, the P/E ratio is a straightforward way to think about what you are paying for each dollar of current earnings. It ties the share price directly to profitability, which most investors watch closely when they assess whether a stock feels expensive or reasonable.
What counts as a “normal” P/E depends on what the market expects from a business and how risky those earnings look. Higher expected growth and lower perceived risk can justify a higher multiple, while slower growth or higher uncertainty generally call for a lower one.
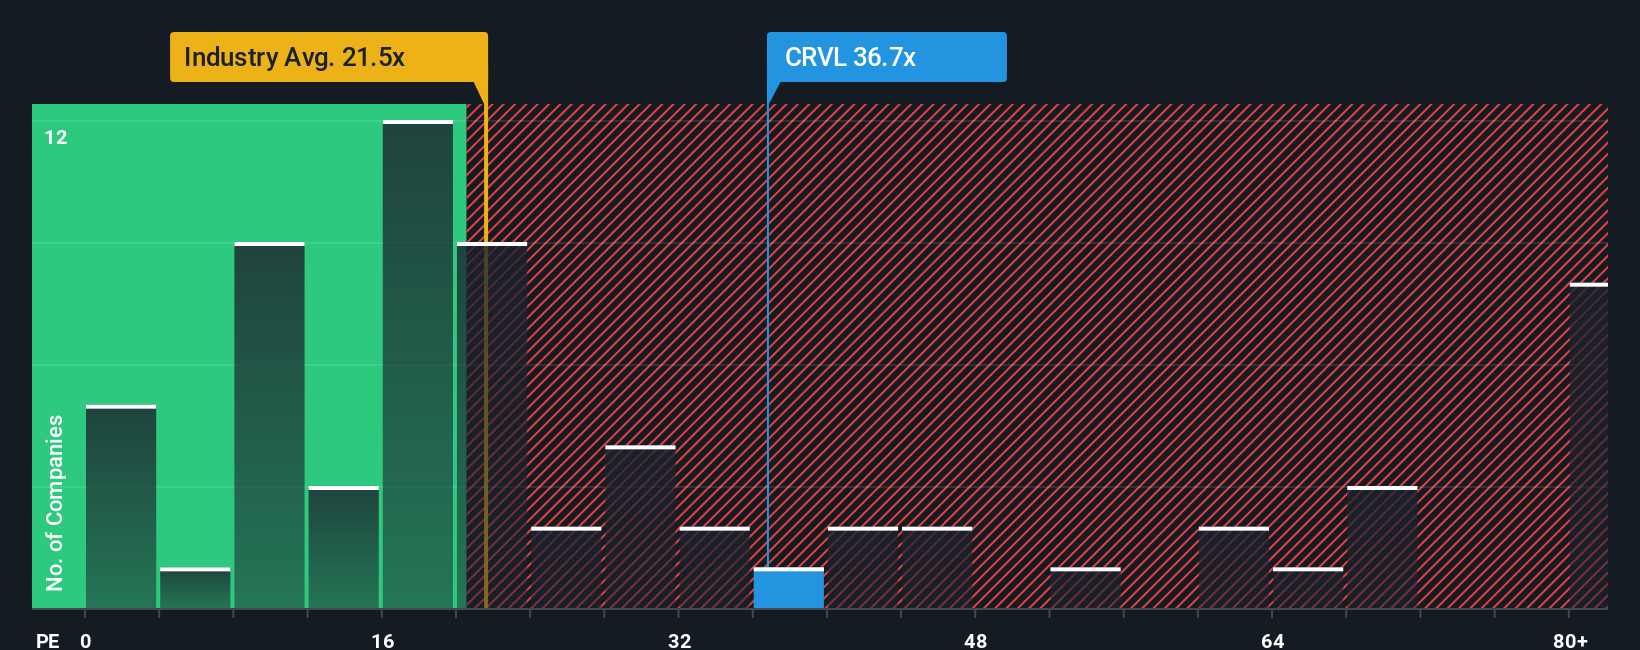
CorVel currently trades on a P/E of 23.5x. This is in line with the Healthcare industry average of about 23.5x and well below the peer group average of 55.0x. Simply Wall St also uses a proprietary “Fair Ratio”, which is the P/E it would expect for CorVel after accounting for factors such as earnings growth, profit margins, the company’s industry, market value and risk profile. Compared with simple peer or industry comparisons, this Fair Ratio is designed to be more tailored to CorVel’s specific characteristics. In this case, the Fair Ratio for CorVel is not available, so this method cannot be used to judge whether the current P/E looks high or low.
Result: ABOUT RIGHT
P/E ratios tell one story, but what if the real opportunity lies elsewhere? Start investing in legacies, not executives. Discover our 22 top founder-led companies.
Upgrade Your Decision Making: Choose your CorVel Narrative
Earlier we mentioned that there is an even better way to understand valuation, so let us introduce you to Narratives. These let you attach a clear story to the numbers, such as your fair value, and your expectations for future revenue, earnings and margins.
A Narrative links what you believe about a company to a simple forecast, then connects that forecast to a fair value that you can compare directly with today’s share price to help you decide whether the stock looks appealing for you.
On Simply Wall St, Narratives sit inside the Community page and are designed to be easy to use. This means you can see how other investors are thinking about CorVel and how their fair values compare with the current price.
Narratives update automatically when new information such as earnings releases or news headlines are added to the platform, so the story and the numbers stay aligned. You might see one CorVel Narrative that assumes a relatively high fair value while another assumes a much lower fair value, reflecting different views on the company’s future.
Do you think there's more to the story for CorVel? Head over to our Community to see what others are saying!

This article by Simply Wall St is general in nature. We provide commentary based on historical data and analyst forecasts only using an unbiased methodology and our articles are not intended to be financial advice. It does not constitute a recommendation to buy or sell any stock, and does not take account of your objectives, or your financial situation. We aim to bring you long-term focused analysis driven by fundamental data. Note that our analysis may not factor in the latest price-sensitive company announcements or qualitative material. Simply Wall St has no position in any stocks mentioned.
Have feedback on this article? Concerned about the content? Get in touch with us directly. Alternatively, email editorial-team@simplywallst.com