
- LIVE QUOTES
- LEARN
- HELP


EN
A Look At Westamerica Bancorporation (WABC) Valuation After Earnings And Revenue Beat Expectations
Westamerica Bancorporation (WABC) recently reported fourth quarter 2025 results that came in ahead of revenue and earnings estimates, supported by low cost deposits, disciplined expenses, stable asset quality, and maintained capital strength.
See our latest analysis for Westamerica Bancorporation.
At a share price of $52.48, Westamerica Bancorporation has seen momentum build recently, with a 30 day share price return of 9.31% and a 1 year total shareholder return of 7.07%. This suggests investors are reacting positively to its resilient earnings, low cost deposits, and steady asset quality.
If this steady banking story has your attention, it could be a good time to broaden your search and check out 22 top founder-led companies as another source of potential ideas.
With WABC trading at $52.48 and sitting at a reported intrinsic discount of about 55%, the key question is simple: is the market overlooking value here, or already pricing in all the future upside?
Price to Earnings of 11.1x: Is it justified?
On a P/E of 11.1x, Westamerica Bancorporation sits below the peer average and the wider US Banks industry, yet above its own estimated fair P/E.
The P/E ratio compares the current share price to earnings per share, so for a bank like WABC it gives a quick read on how the market is valuing its earnings power today.
WABC is described as good value versus both the US Banks industry average P/E of 12x and a peer average of 15.6x. This suggests the market is applying a lower earnings multiple than many comparable banks. However, that same earnings stream is labeled expensive against an estimated fair P/E of 8.7x. This is a level the market could move toward if sentiment or expectations cool.
This mix of cheaper than peers but richer than its own fair ratio creates an interesting tension for investors weighing whether the current 11.1x P/E leaves enough room for potential re rating or instead reflects a full price for expected earnings.
Explore the SWS fair ratio for Westamerica Bancorporation
Result: Price-to-Earnings of 11.1x (ABOUT RIGHT)
However, you still have to weigh risks such as annual revenue and net income growth declining by 5.0% and 11.1%, which could pressure sentiment if these trends continue.
Find out about the key risks to this Westamerica Bancorporation narrative.
Another View: DCF Paints a Very Different Picture
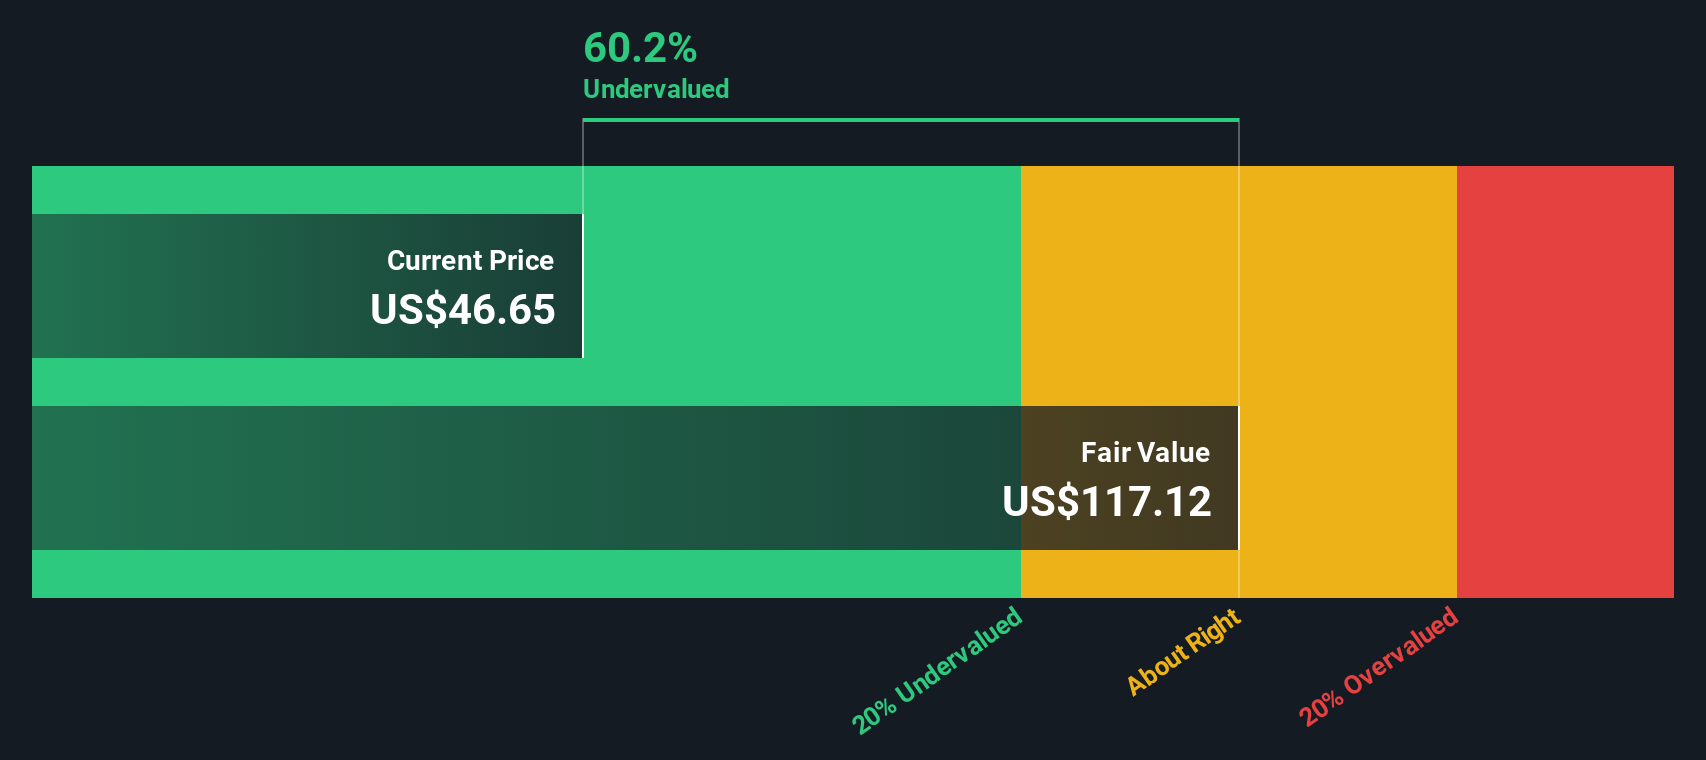
While the 11.1x P/E suggests WABC is roughly in line with what you might expect for a steady bank, our DCF model presents a different perspective. On that measure, the shares at $52.48 sit below an estimated future cash flow value of $117.70, indicating a gap between price and modeled value. The open question is whether that gap reflects appropriate caution or a potential opportunity.
Look into how the SWS DCF model arrives at its fair value.
Simply Wall St performs a discounted cash flow (DCF) on every stock in the world every day (check out Westamerica Bancorporation for example). We show the entire calculation in full. You can track the result in your watchlist or portfolio and be alerted when this changes, or use our stock screener to discover 53 high quality undervalued stocks. If you save a screener we even alert you when new companies match - so you never miss a potential opportunity.
Build Your Own Westamerica Bancorporation Narrative
If you see the numbers differently or prefer to work from your own assumptions, you can pull the data together and shape a full view in just a few minutes, then Do it your way.
A great starting point for your Westamerica Bancorporation research is our analysis highlighting 2 key rewards and 1 important warning sign that could impact your investment decision.
Looking for more investment ideas?
If you are serious about building a stronger portfolio, do not stop at just one bank stock. Use the screener tools to quickly surface other focused ideas.
- Target potential value opportunities by scanning companies trading on attractive fundamentals with our 53 high quality undervalued stocks that may line up with your return and risk preferences.
- Prioritize resilience first and hunt for companies that score well on stability using the 86 resilient stocks with low risk scores that filters for lower risk profiles.
- Spot under the radar potential by running the screener containing 24 high quality undiscovered gems that highlights companies with strong fundamentals that the broader market might not be watching closely yet.
This article by Simply Wall St is general in nature. We provide commentary based on historical data and analyst forecasts only using an unbiased methodology and our articles are not intended to be financial advice. It does not constitute a recommendation to buy or sell any stock, and does not take account of your objectives, or your financial situation. We aim to bring you long-term focused analysis driven by fundamental data. Note that our analysis may not factor in the latest price-sensitive company announcements or qualitative material. Simply Wall St has no position in any stocks mentioned.
Have feedback on this article? Concerned about the content? Get in touch with us directly. Alternatively, email editorial-team@simplywallst.com