
- LIVE QUOTES
- LEARN
- HELP
 Nasdaq
 Wall Street Journal
EN
Is BioNTech (BNTX) Pricing Reflecting Its Mixed Returns And Conflicting Valuation Signals?
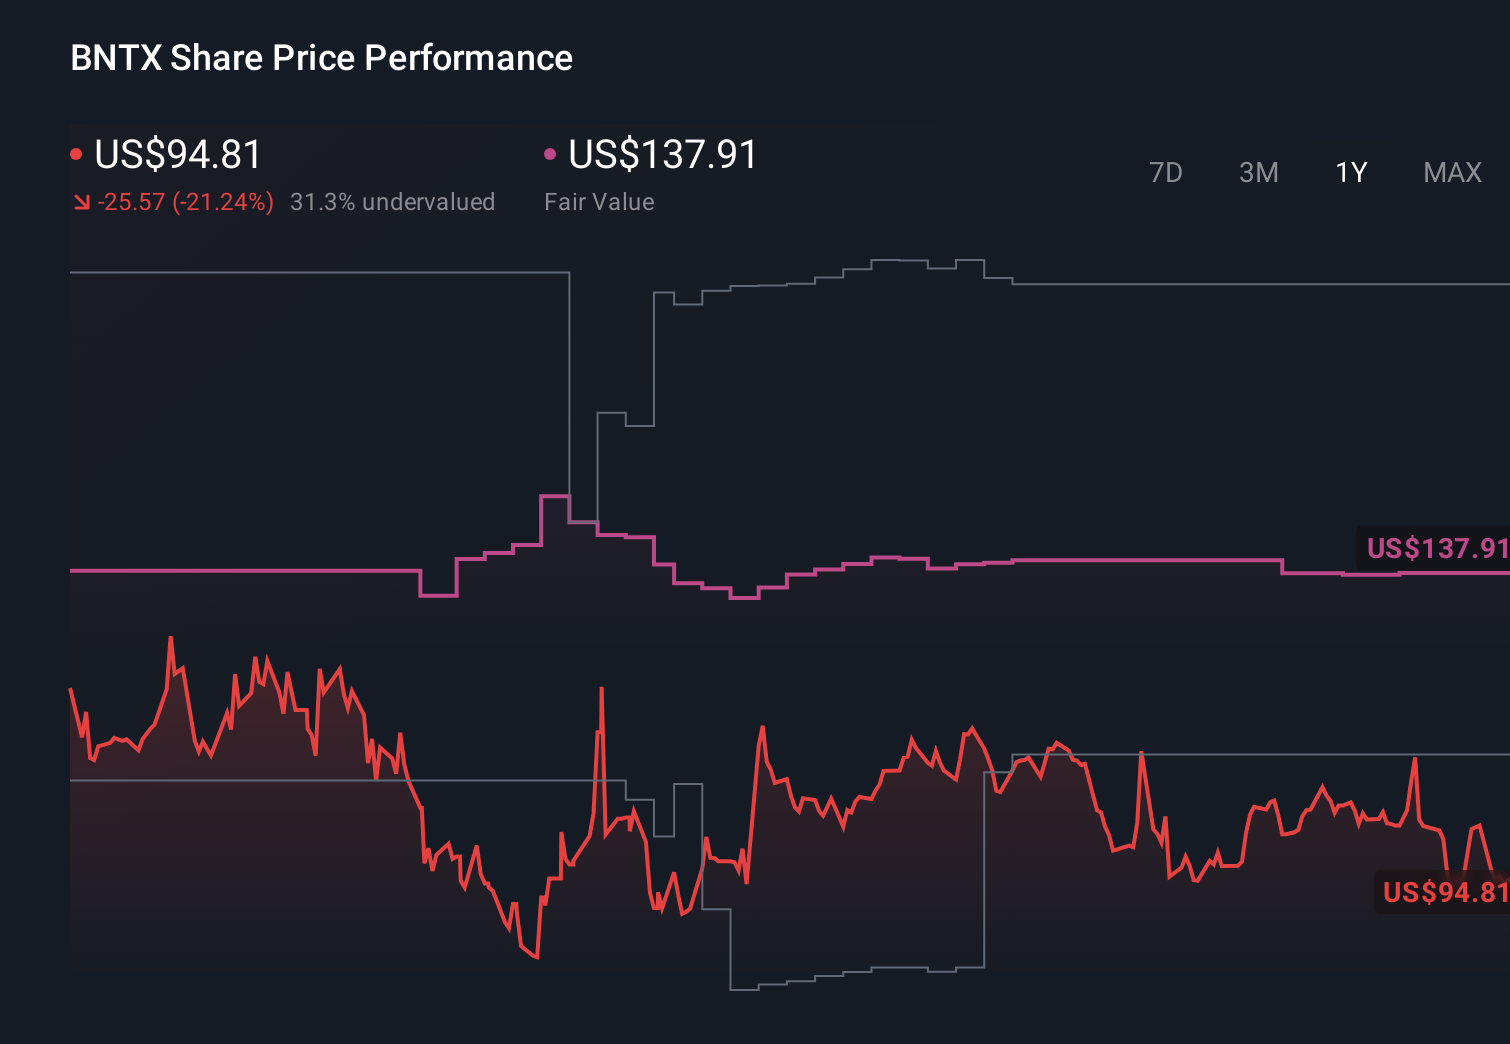
- If you are wondering whether BioNTech is currently priced attractively or not, the key question is whether the market is fairly reflecting the company’s long term prospects in its share price.
- The stock recently closed at US$106.62, with a 6.3% decline over the last 7 days, a 6.5% gain over the last 30 days and a 10.3% return year to date, while the 1 year, 3 year and 5 year returns stand at a 9.3% decline, 24.7% decline and 8.4% decline respectively.
- These mixed returns sit against a backdrop of ongoing interest in BioNTech’s position in pharmaceuticals and biotech. Investors continue to assess how its pipeline and partnerships might influence the long term story. That broader context is important because it helps explain why sentiment around the stock can shift quickly, even when day to day news flow seems limited.
- Our valuation checks give BioNTech a score of 4 out of 6. This sets the stage for a closer look at how different valuation approaches stack up and how you can go one step further by understanding the underlying assumptions behind them later in this article.
Find out why BioNTech's -9.3% return over the last year is lagging behind its peers.
Approach 1: BioNTech Discounted Cash Flow (DCF) Analysis
A Discounted Cash Flow, or DCF, model estimates what a company might be worth by projecting its future cash flows and then discounting those back to today’s value. In this case, the model used is a 2 Stage Free Cash Flow to Equity approach.
For BioNTech, the latest twelve month free cash flow stands at a loss of about €806.3m. Analyst and model projections show free cash flow staying negative in the nearer years, then turning positive, reaching €438.96m in 2030. Beyond the explicit analyst period, Simply Wall St extrapolates further annual free cash flow figures, also in millions of euros.
Bringing all those projected cash flows back to today and adding a terminal value results in an estimated fair value of €173.51 per share. Against a recent share price of US$106.62, this implies the stock is 38.6% below that DCF estimate. On this model, that difference suggests a meaningful valuation gap.
Result: UNDERVALUED
Our Discounted Cash Flow (DCF) analysis suggests BioNTech is undervalued by 38.6%. Track this in your watchlist or portfolio, or discover 53 more high quality undervalued stocks.
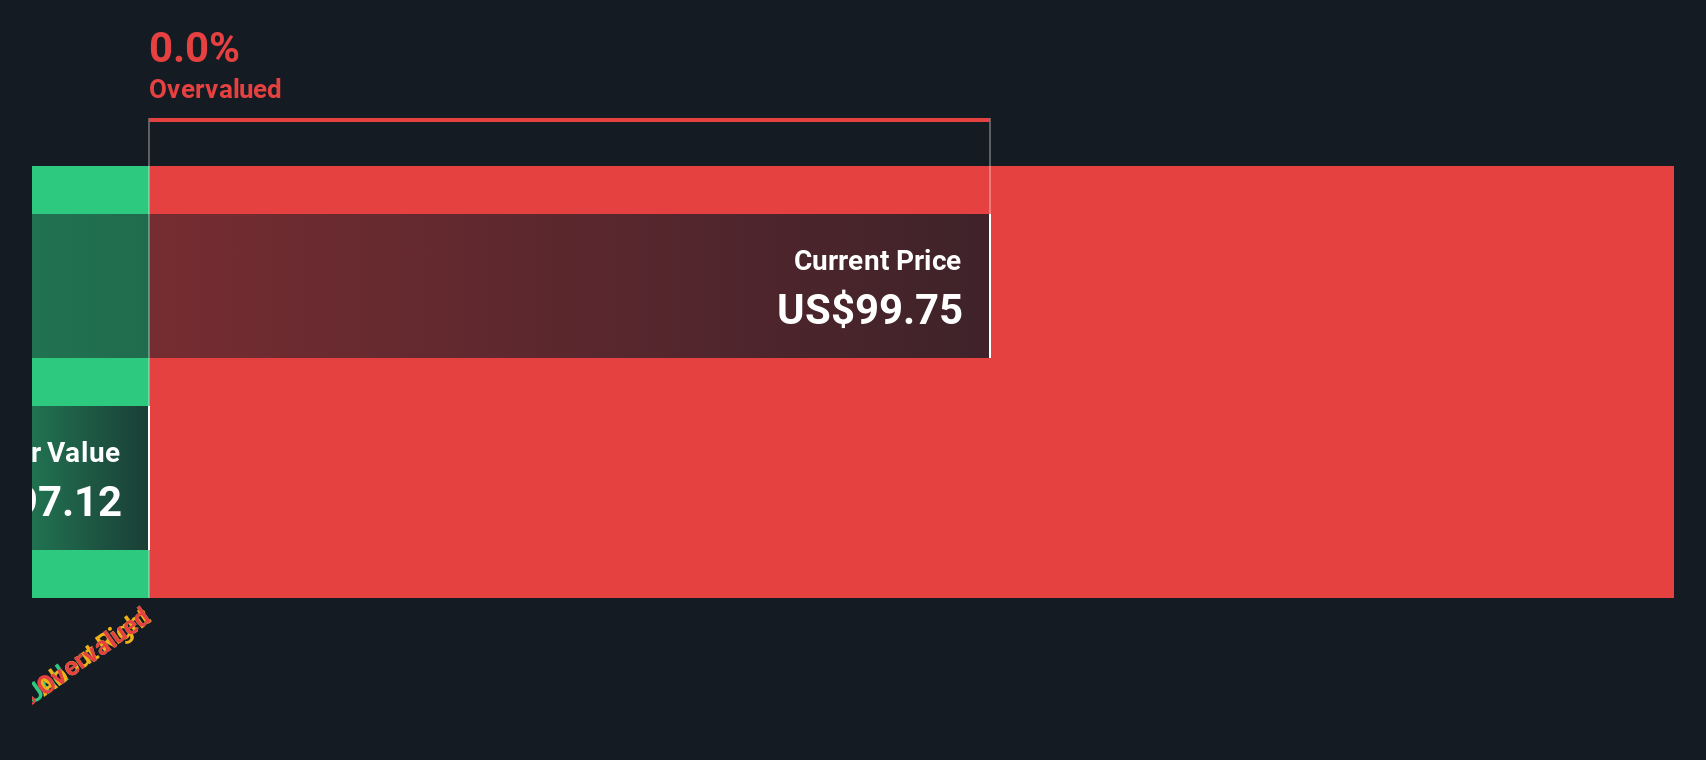
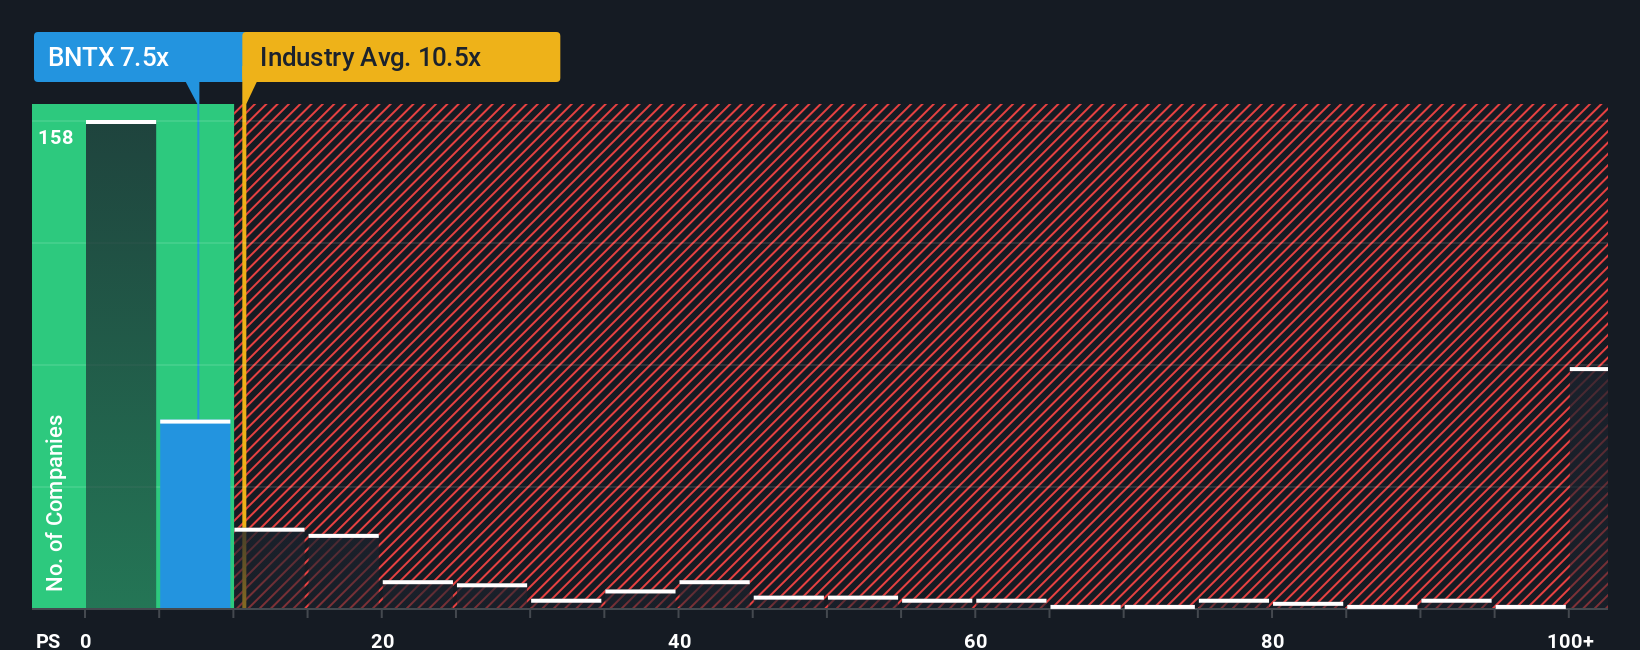
Approach 2: BioNTech Price vs Sales
For companies where profits are volatile or negative, the P/S ratio is often a useful way to think about value because it focuses on revenue rather than earnings. The level of P/S investors are usually comfortable with tends to reflect how they see the balance between growth potential and risk, with higher growth and lower perceived risk often going hand in hand with a higher “normal” multiple.
BioNTech currently trades on a P/S of 7.18x. That sits below the broader Biotechs industry average of 11.15x and above the peer group average of 5.23x. Simply Wall St also calculates a proprietary “Fair Ratio” of 6.06x, which is the P/S level suggested after weighing factors such as BioNTech’s earnings growth profile, profit margins, industry, market cap and company specific risks.
This Fair Ratio can be more informative than a simple comparison with peers or the sector, because it adjusts for the fact that not all Biotech names share the same growth outlook, balance sheet strength or risk profile. When set against that Fair Ratio of 6.06x, BioNTech’s current P/S of 7.18x points to the shares trading above what the model suggests as a balanced level.
Result: OVERVALUED
P/S ratios tell one story, but what if the real opportunity lies elsewhere? Start investing in legacies, not executives. Discover our 22 top founder-led companies.
Upgrade Your Decision Making: Choose your BioNTech Narrative
Earlier we mentioned that there is an even better way to understand valuation, so let us introduce you to Narratives.
A Narrative is simply your story about a company, written in numbers, where you connect your view of its future with your own estimates for revenue, earnings and margins, then link that to a fair value per share.
On Simply Wall St, Narratives sit inside the Community page and are used by millions of investors as an easy tool that ties a company’s story to a financial forecast and then to a fair value that can be compared with the current share price to help decide whether it looks attractive or not for their goals.
Your Narrative for BioNTech might see its pipeline as highly promising and support a higher fair value. Another investor might take a more cautious view that leads to a much lower fair value. Both Narratives update automatically when new earnings, news or other company data is released.
Do you think there's more to the story for BioNTech? Head over to our Community to see what others are saying!
This article by Simply Wall St is general in nature. We provide commentary based on historical data and analyst forecasts only using an unbiased methodology and our articles are not intended to be financial advice. It does not constitute a recommendation to buy or sell any stock, and does not take account of your objectives, or your financial situation. We aim to bring you long-term focused analysis driven by fundamental data. Note that our analysis may not factor in the latest price-sensitive company announcements or qualitative material. Simply Wall St has no position in any stocks mentioned.
Have feedback on this article? Concerned about the content? Get in touch with us directly. Alternatively, email editorial-team@simplywallst.com