
- LIVE QUOTES
- LEARN
- HELP
 Nasdaq
 Wall Street Journal
EN
Is It Too Late To Consider Clean Harbors (CLH) After A 211% Five-Year Run?
- If you have been wondering whether Clean Harbors shares still offer solid value after a strong run, this article will walk through what the current price might be implying.
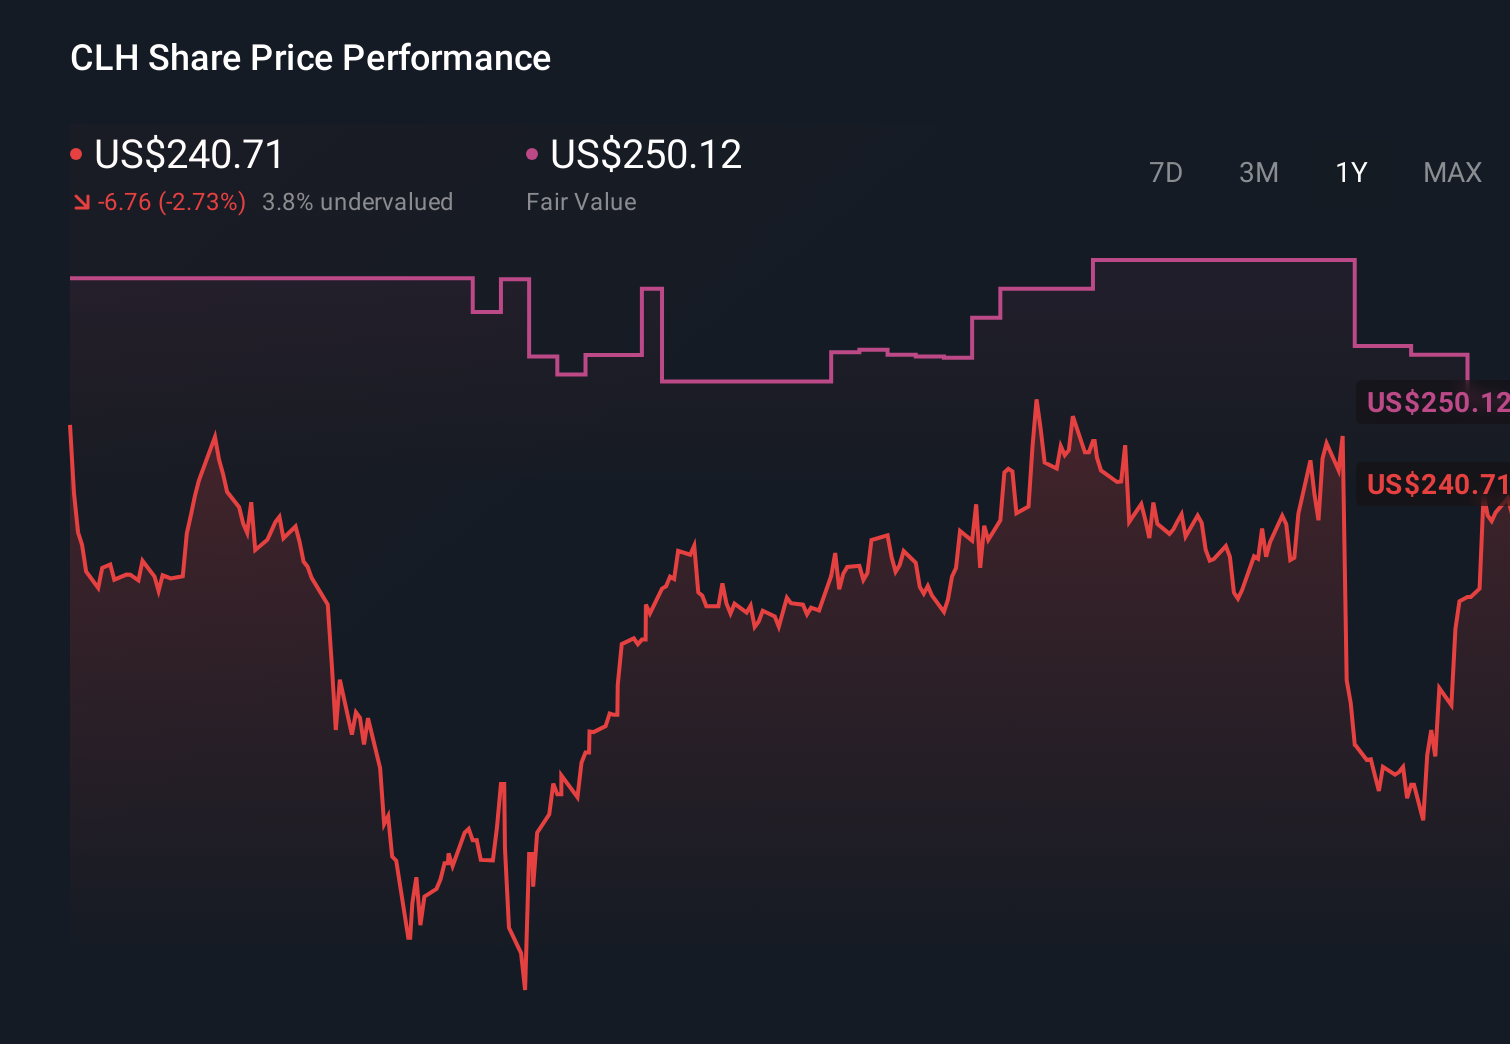
- The stock last closed at US$265.98, with returns of 2.3% over 7 days, 9.4% over 30 days, 9.3% year to date, 13.5% over 1 year, 98.3% over 3 years and 211.4% over 5 years. This performance may have shifted how some investors think about its future risk and reward.
- Recent coverage has focused on Clean Harbors as a key player in environmental and industrial services, with attention on how its hazardous waste management and related offerings fit into long term demand for environmental compliance. This context helps frame why the share price performance has attracted fresh interest from both existing shareholders and new investors looking at the sector.
- On our framework of 6 valuation checks, Clean Harbors currently scores 3 out of 6. We will look at what traditional valuation tools like P/E, cash flow models and peer comparisons are indicating, then finish with a more complete way of thinking about the company’s value that pulls those pieces together.
Approach 1: Clean Harbors Discounted Cash Flow (DCF) Analysis
A Discounted Cash Flow, or DCF, model takes estimates of the cash a company might generate in the future and discounts those cash flows back to today, aiming to arrive at an estimate of what the business could be worth per share right now.
For Clean Harbors, the model used is a 2 Stage Free Cash Flow to Equity approach. The company’s latest twelve month free cash flow is about $372 million. Analysts provide explicit free cash flow estimates for the next few years. Beyond that point, Simply Wall St extrapolates the path of cash flows, reaching a projected free cash flow of $793 million in 2030. All of these cash flows are in US$ and are discounted back to today in the model.
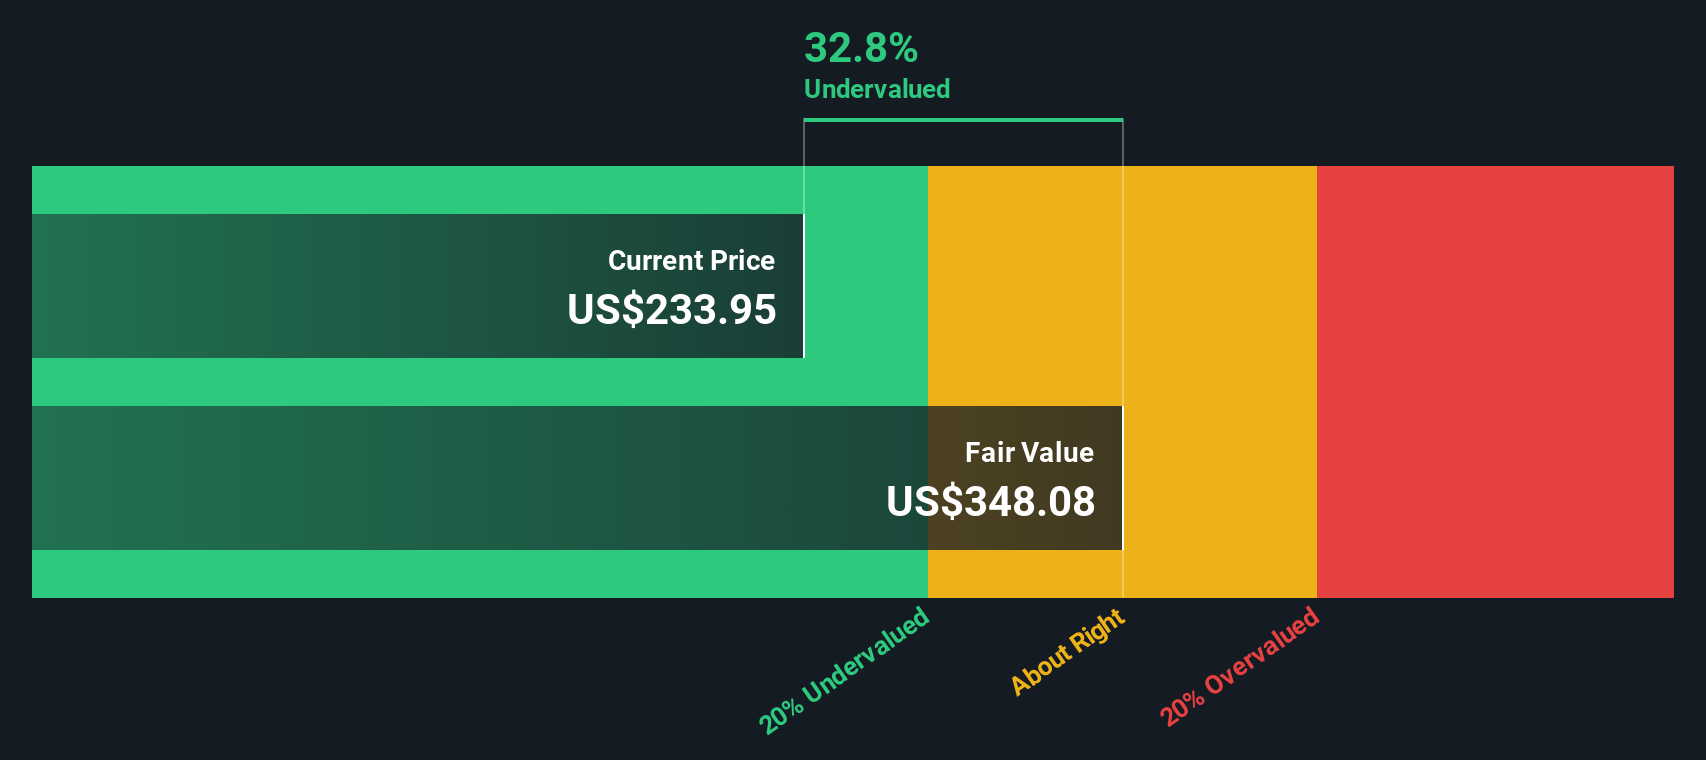
On this basis, the DCF model suggests an estimated intrinsic value of about $360.25 per share. Compared with the recent share price of $265.98, the model implies the stock is about 26.2% undervalued.
Result: UNDERVALUED
Our Discounted Cash Flow (DCF) analysis suggests Clean Harbors is undervalued by 26.2%. Track this in your watchlist or portfolio, or discover 53 more high quality undervalued stocks.
Approach 2: Clean Harbors Price vs Earnings
For a profitable company like Clean Harbors, the P/E ratio is a useful way to see how much investors are paying for each dollar of earnings. A higher P/E can reflect stronger growth expectations or lower perceived risk, while a lower P/E can point to more muted growth assumptions or higher uncertainty.
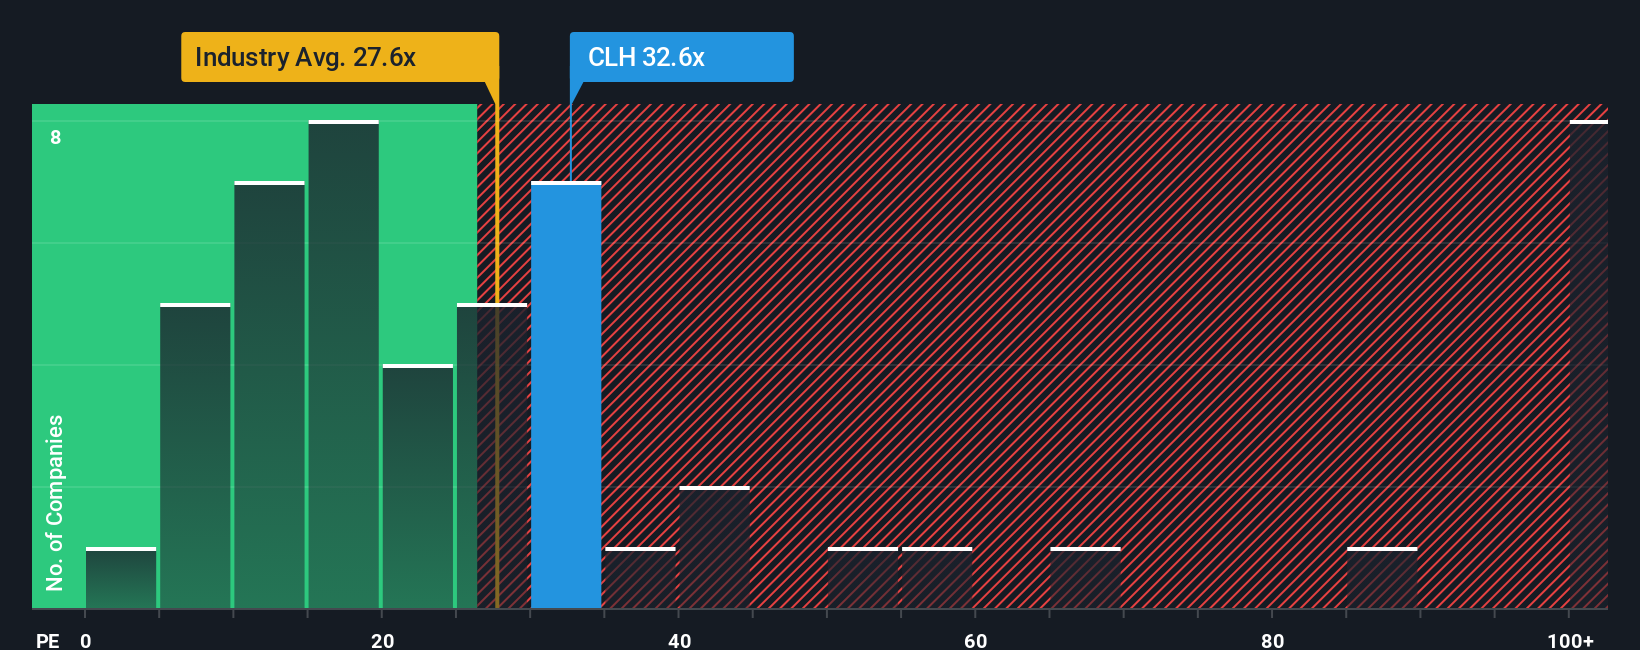
Clean Harbors currently trades on a P/E of 36.59x. That sits above the Commercial Services industry average of 26.08x and below the peer group average of 46.15x, so the stock is priced between the broader industry and closer peers. Simply Wall St also calculates a Fair Ratio of 26.26x, which is the P/E it would expect given factors such as earnings growth, profit margin, company size, industry and specific risks.
This Fair Ratio aims to be more tailored than a simple industry or peer comparison because it adjusts for the company’s own profile rather than assuming all Commercial Services businesses deserve the same valuation. Comparing the Fair Ratio of 26.26x with the actual P/E of 36.59x suggests Clean Harbors shares are trading above this modelled level.
Result: OVERVALUED
P/E ratios tell one story, but what if the real opportunity lies elsewhere? Start investing in legacies, not executives. Discover our 22 top founder-led companies.
Upgrade Your Decision Making: Choose your Clean Harbors Narrative
Earlier we mentioned that there is an even better way to understand valuation, so let us introduce you to Narratives, which bring your view of Clean Harbors together with the numbers behind it.
A Narrative is simply your story about the company, backed by your own assumptions for fair value, future revenue, earnings and margins, instead of relying only on a single model or market multiple.
On Simply Wall St, Narratives live in the Community page and link that story to a financial forecast and then to a fair value. This allows you to easily compare that fair value with the current share price and decide whether Clean Harbors looks attractive, fairly priced or expensive based on your view.
Narratives on the platform are refreshed when new information such as earnings releases or news is added. Different investors can hold very different views on Clean Harbors. For example, one Narrative might point to a materially higher fair value than today’s price, while another suggests a materially lower figure based on more cautious forecasts.
Do you think there's more to the story for Clean Harbors? Head over to our Community to see what others are saying!
This article by Simply Wall St is general in nature. We provide commentary based on historical data and analyst forecasts only using an unbiased methodology and our articles are not intended to be financial advice. It does not constitute a recommendation to buy or sell any stock, and does not take account of your objectives, or your financial situation. We aim to bring you long-term focused analysis driven by fundamental data. Note that our analysis may not factor in the latest price-sensitive company announcements or qualitative material. Simply Wall St has no position in any stocks mentioned.
Have feedback on this article? Concerned about the content? Get in touch with us directly. Alternatively, email editorial-team@simplywallst.com