
- LIVE QUOTES
- LEARN
- HELP
 Nasdaq
 Wall Street Journal
EN
Is Eaton (ETN) Still Attractively Priced After Its Sharp Multi Year Share Price Surge
- If you are wondering whether Eaton's share price still offers value after a strong run, you are not alone. This article is built to help you weigh what you are really paying for.
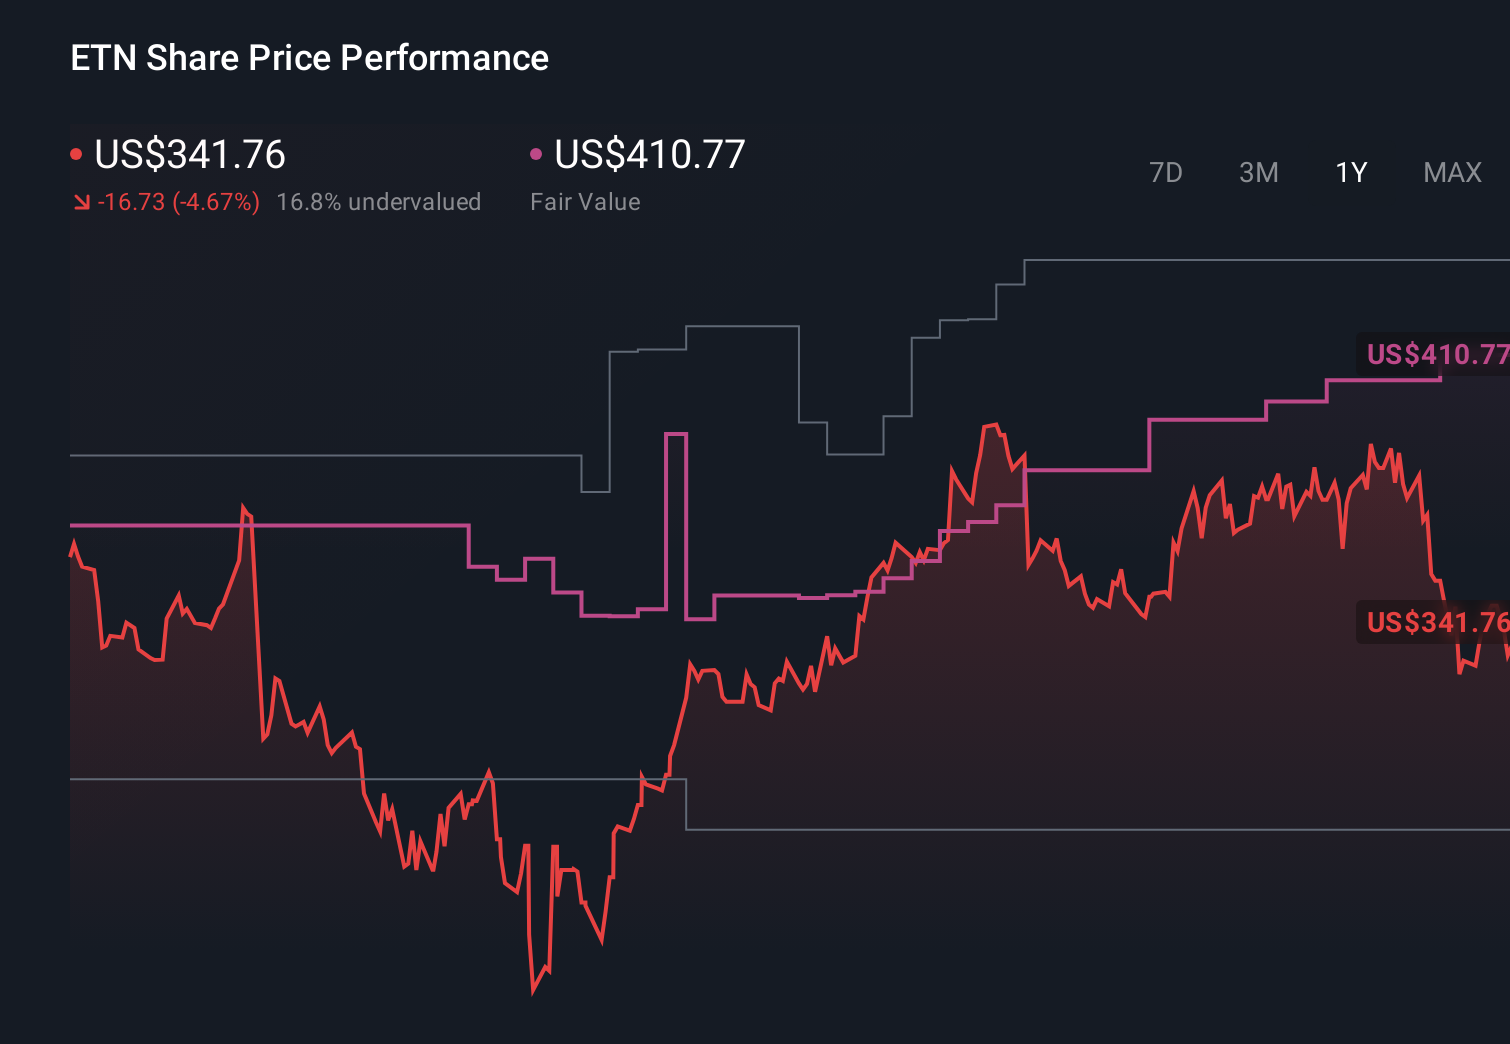
- Eaton recently closed at US$373.82, with returns of 6.4% over 7 days, 15.9% over 30 days, 14.2% year to date, 20.9% over 1 year and a very large 3 year and 5 year return profile of 128.3% and 228.1% respectively.
- Recent news around Eaton has focused on its position as a major capital goods player, government and private sector interest in electrical infrastructure, and ongoing attention on companies tied to power management and grid reliability. These themes have kept investors watching Eaton as markets assess how those industry drivers may feed into expectations and risk appetite for the stock.
- Right now Eaton scores 3 out of 6 on our valuation checks. You can see the full breakdown in our valuation score. Next we will walk through the main valuation approaches behind that number and finish by looking at a more complete way to think about what the stock might be worth.
Find out why Eaton's 20.9% return over the last year is lagging behind its peers.
Approach 1: Eaton Discounted Cash Flow (DCF) Analysis
A Discounted Cash Flow model takes projected future cash flows, then discounts them back to today to estimate what the business may be worth in present dollar terms. It is essentially asking what Eaton's future cash generation could be worth now.
For Eaton, the model used is a 2 Stage Free Cash Flow to Equity approach. The latest twelve month free cash flow sits at about US$3.3b. Analysts provide explicit free cash flow estimates for the next few years, and Simply Wall St then extrapolates further out, with a projected free cash flow of US$7.0b in 2030. Each of these future cash flows is discounted back to today using the model's required return assumptions.
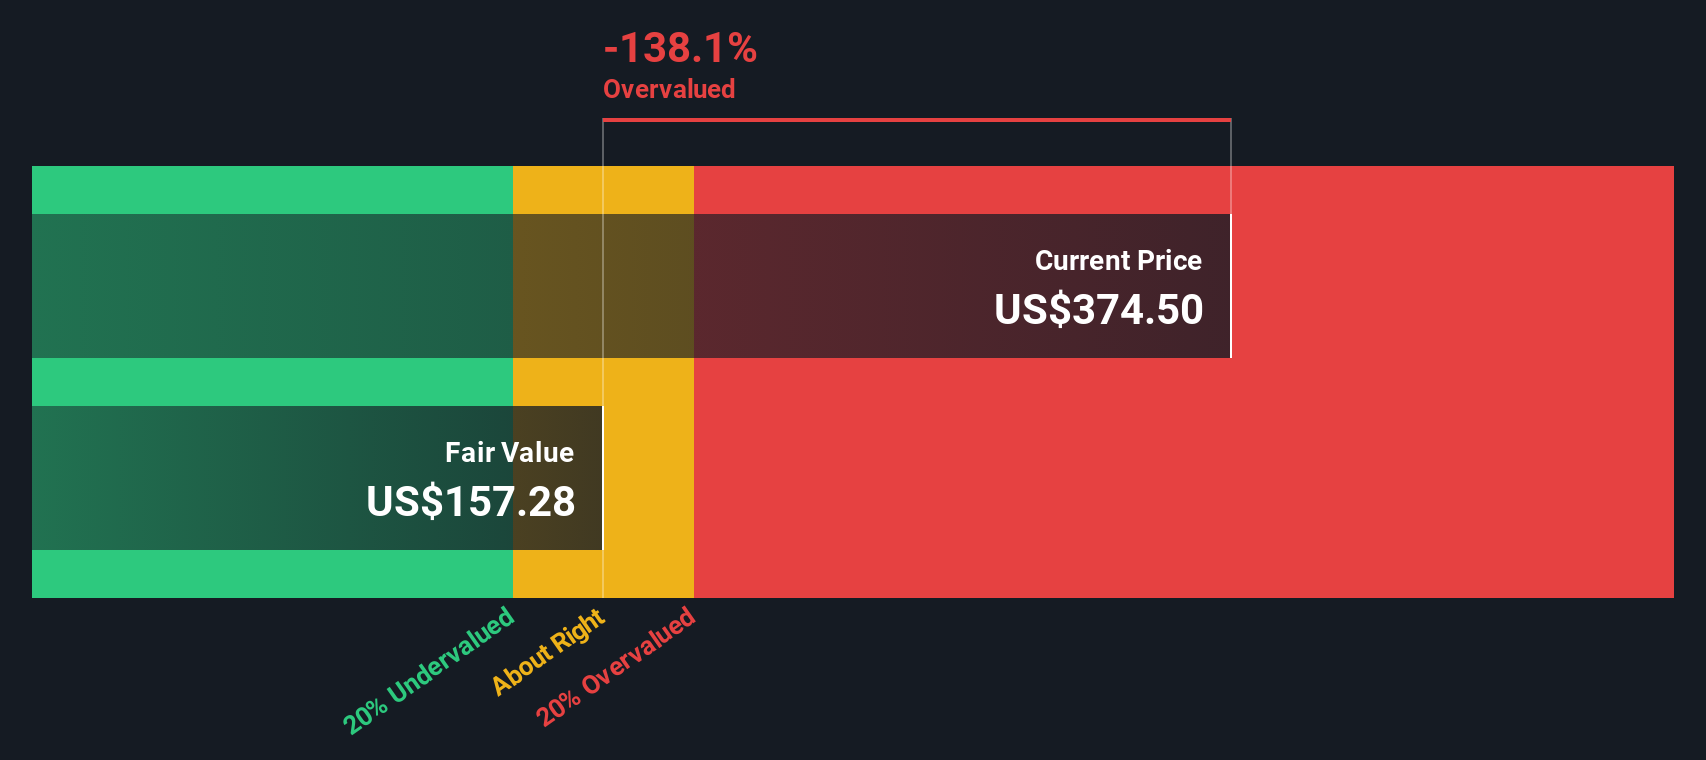
On this basis, the DCF model suggests an intrinsic value of about US$230.10 per share for Eaton, compared with the recent share price of US$373.82. That gap implies the shares are roughly 62.5% above the model's estimate of fair value.
Result: OVERVALUED
Our Discounted Cash Flow (DCF) analysis suggests Eaton may be overvalued by 62.5%. Discover 53 high quality undervalued stocks or create your own screener to find better value opportunities.
Approach 2: Eaton Price vs Earnings
For a profitable company like Eaton, the P/E ratio is a useful way to relate what you are paying for each share to the earnings that support it. It helps you see how many dollars of share price the market is attaching to each dollar of current earnings.
What counts as a "normal" P/E depends on how the market views a company’s growth potential and risk. Higher expected growth or lower perceived risk typically justify a higher P/E, while slower growth or higher risk usually align with a lower P/E.
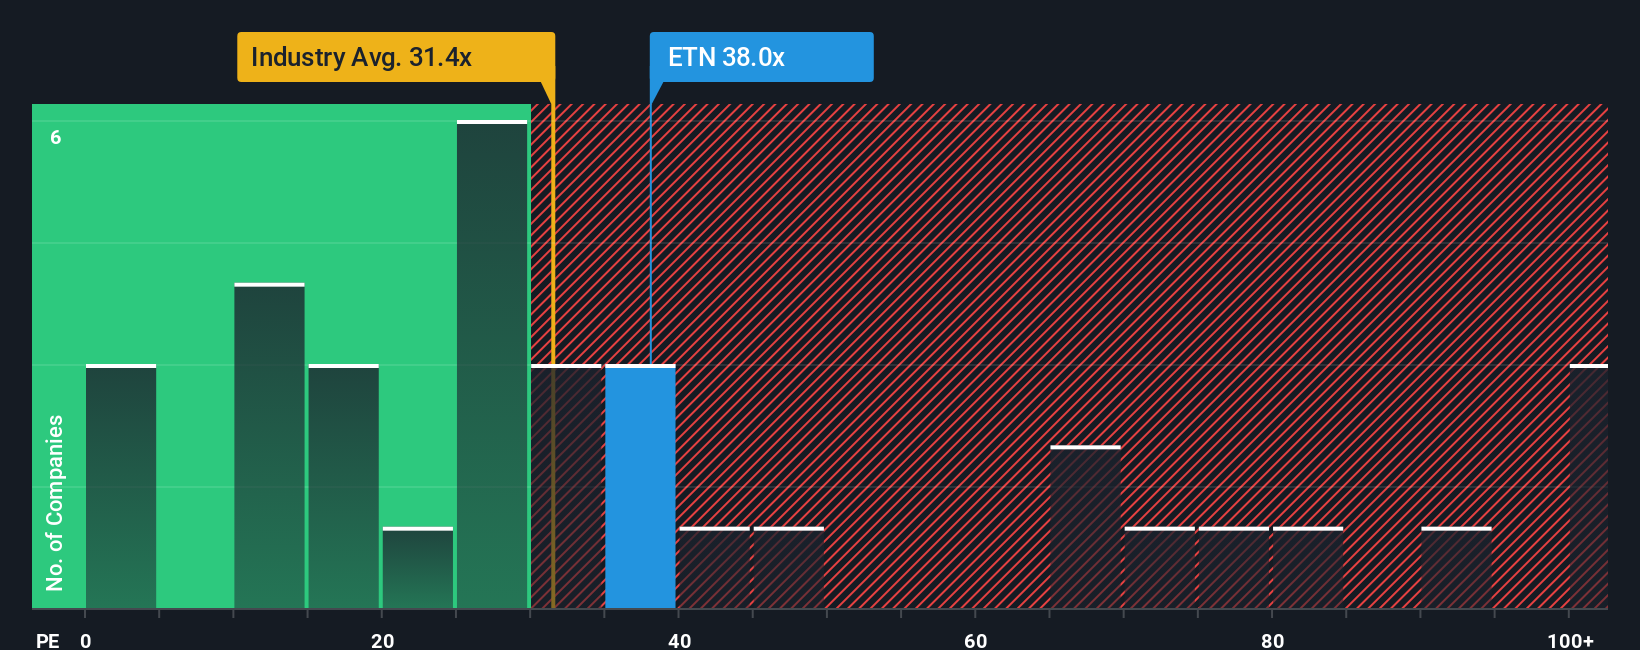
Eaton currently trades on a P/E of 35.53x. That sits close to the Electrical industry average P/E of 35.80x and below the peer group average of 48.49x. Simply Wall St also calculates a proprietary Fair Ratio of 39.68x for Eaton, which reflects factors like its earnings growth profile, margins, industry, market cap and risk characteristics.
The Fair Ratio aims to be more tailored than a simple comparison to peers or the broad industry, because it adjusts for those company specific features rather than assuming one size fits all. Comparing 39.68x to the current 35.53x suggests the market multiple is below this Fair Ratio, which points to Eaton looking undervalued on this metric.
Result: UNDERVALUED
P/E ratios tell one story, but what if the real opportunity lies elsewhere? Start investing in legacies, not executives. Discover our 22 top founder-led companies.
Upgrade Your Decision Making: Choose your Eaton Narrative
Earlier we mentioned that there is an even better way to understand valuation, so let us introduce you to Narratives, which connect the story you believe about a company to the numbers behind it. A Narrative is your view on a business like Eaton, written as a simple story and backed by your own assumptions for fair value, future revenue, earnings and margins. On Simply Wall St, within the Community page used by millions of investors, Narratives link that story to a full forecast and a fair value estimate that you can compare directly to the current share price to help inform your investment timing. They also update as new information such as news or earnings is added, so your thesis and valuation can stay aligned with the latest data. For Eaton, one investor might set a lower fair value with more cautious revenue and margin assumptions, while another might set a higher fair value based on stronger expectations, and each can clearly see how their story translates into numbers and decisions.
Do you think there's more to the story for Eaton? Head over to our Community to see what others are saying!
This article by Simply Wall St is general in nature. We provide commentary based on historical data and analyst forecasts only using an unbiased methodology and our articles are not intended to be financial advice. It does not constitute a recommendation to buy or sell any stock, and does not take account of your objectives, or your financial situation. We aim to bring you long-term focused analysis driven by fundamental data. Note that our analysis may not factor in the latest price-sensitive company announcements or qualitative material. Simply Wall St has no position in any stocks mentioned.
Have feedback on this article? Concerned about the content? Get in touch with us directly. Alternatively, email editorial-team@simplywallst.com