
- LIVE QUOTES
- LEARN
- HELP
 Nasdaq
 Wall Street Journal
EN
Is Navios Maritime Partners (NMM) Still Attractive After Strong 12‑Month Rally?
- If you are wondering whether Navios Maritime Partners is still good value after its recent run, you are in the right place. This article will focus squarely on what the current price might imply about the stock.
- The units most recently closed at US$60.22, with returns of 0.7% over 7 days, 8.6% over 30 days, 17.2% year to date and 41.2% over the last year, so many holders may be asking whether the current price already reflects these gains.
- Recent news around Navios Maritime Partners has focused on its position within the broader shipping and maritime transport space and how investors are thinking about dry bulk and container exposure. This context helps frame how the market has been reassessing risk and potential rewards for the partnership in recent months.
- On our checks, Navios Maritime Partners scores 5 out of 6 on valuation, giving it a 5/6 value score, which suggests several metrics point to potential undervaluation. Next we will look at the usual valuation tools like multiples and cash flow models, then finish with a more complete way to think about value that pulls everything together.
Approach 1: Navios Maritime Partners Discounted Cash Flow (DCF) Analysis
A Discounted Cash Flow, or DCF, model estimates what a business might be worth by projecting its future cash flows and discounting them back to today’s value. It is essentially asking what all those future dollars are worth in present terms.
For Navios Maritime Partners, the model used is a 2 Stage Free Cash Flow to Equity approach. The latest twelve month free cash flow is a loss of about US$160.1 million, so the current cash generation is weak on this measure. The model then uses projections that point to free cash flow of US$313 million in 2026 and US$444 million in 2027, with further estimates extended out to 2035 using Simply Wall St’s extrapolations.
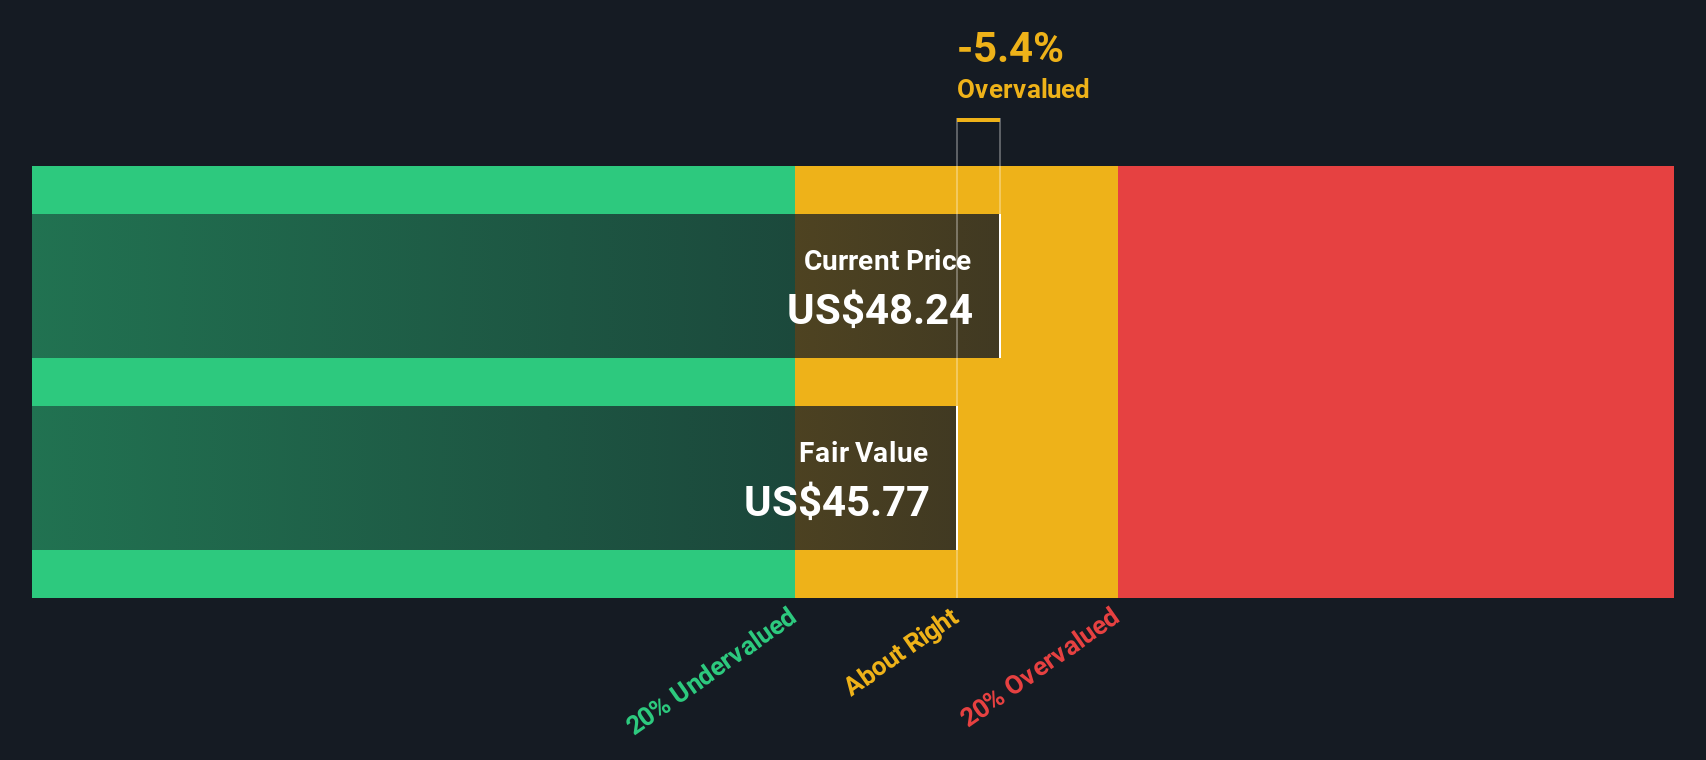
Putting all of these projected cash flows together, discounted back to today, the DCF model arrives at an estimated intrinsic value of about US$228.00 per unit. Compared with the recent price of US$60.22, this output implies the units trade at a 73.6% discount to that estimate, suggesting they screen as materially undervalued on this method.
Result: UNDERVALUED
Our Discounted Cash Flow (DCF) analysis suggests Navios Maritime Partners is undervalued by 73.6%. Track this in your watchlist or portfolio, or discover 53 more high quality undervalued stocks.
Approach 2: Navios Maritime Partners Price vs Earnings
For a profitable company, the P/E ratio is a straightforward way to think about what you are paying for each dollar of earnings. It ties the unit price directly to the partnership’s current earnings power, which many investors use as a quick reality check on valuation.
What counts as a “normal” P/E often comes down to two things: growth expectations and risk. Higher expected earnings growth or lower perceived risk can justify a higher multiple, while slower growth or higher risk usually calls for a lower one.
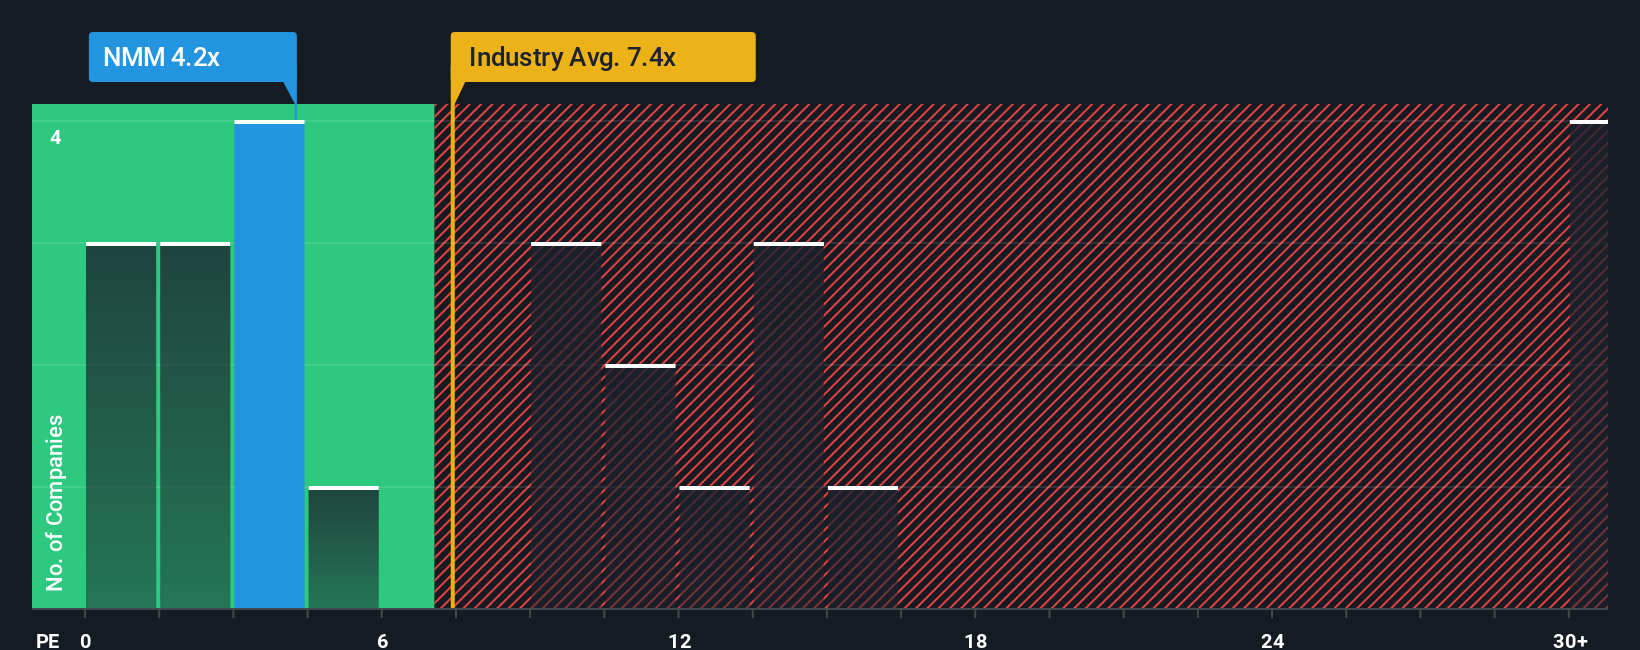
Navios Maritime Partners currently trades on a P/E of 6.73x. That sits below the Shipping industry average of 10.08x and the broader peer average of 13.94x. Simply Wall St also calculates a proprietary “Fair Ratio” of 15.16x for Navios Maritime Partners, which is the P/E level suggested after considering factors like its earnings profile, industry, profit margins, size and risk characteristics.
This Fair Ratio aims to be more tailored than a simple comparison with peers or the industry, because it adjusts for those company specific factors rather than assuming one size fits all. Comparing the Fair Ratio of 15.16x with the current P/E of 6.73x indicates the units screen as undervalued on this metric.
Result: UNDERVALUED
P/E ratios tell one story, but what if the real opportunity lies elsewhere? Start investing in legacies, not executives. Discover our 22 top founder-led companies.
Upgrade Your Decision Making: Choose your Navios Maritime Partners Narrative
Earlier we mentioned that there is a better way to understand valuation, so let us introduce you to Narratives, which are simply your story about a company linked directly to your own numbers for fair value, future revenue, earnings and margins.
Instead of just looking at a P/E or a DCF in isolation, a Narrative connects what you believe about Navios Maritime Partners to a full financial forecast, then turns that forecast into a fair value that you can compare with the current price to decide whether you see it as attractive, fully priced or expensive.
These Narratives are available on Simply Wall St’s Community page, where millions of investors share their views. They update automatically when new information like news or earnings is added, so your fair value view always reflects the latest inputs without extra work from you.
For example, one investor might build a Narrative for Navios Maritime Partners with very optimistic revenue and margin assumptions that support a much higher fair value. Another might plug in more conservative forecasts that lead to a lower fair value and a very different view on whether to buy, hold or sell at today’s price.
Do you think there's more to the story for Navios Maritime Partners? Head over to our Community to see what others are saying!

This article by Simply Wall St is general in nature. We provide commentary based on historical data and analyst forecasts only using an unbiased methodology and our articles are not intended to be financial advice. It does not constitute a recommendation to buy or sell any stock, and does not take account of your objectives, or your financial situation. We aim to bring you long-term focused analysis driven by fundamental data. Note that our analysis may not factor in the latest price-sensitive company announcements or qualitative material. Simply Wall St has no position in any stocks mentioned.
Have feedback on this article? Concerned about the content? Get in touch with us directly. Alternatively, email editorial-team@simplywallst.com