
- LIVE QUOTES
- LEARN
- HELP
 Nasdaq
 Wall Street Journal
EN
Is It Too Late To Consider Marex Group (MRX) After Recent Share Price Gains?
- For investors wondering whether Marex Group at around US$40.48 is offering good value right now or if the easy money has already been made, this article is designed to help you assess that using a clear valuation lens.
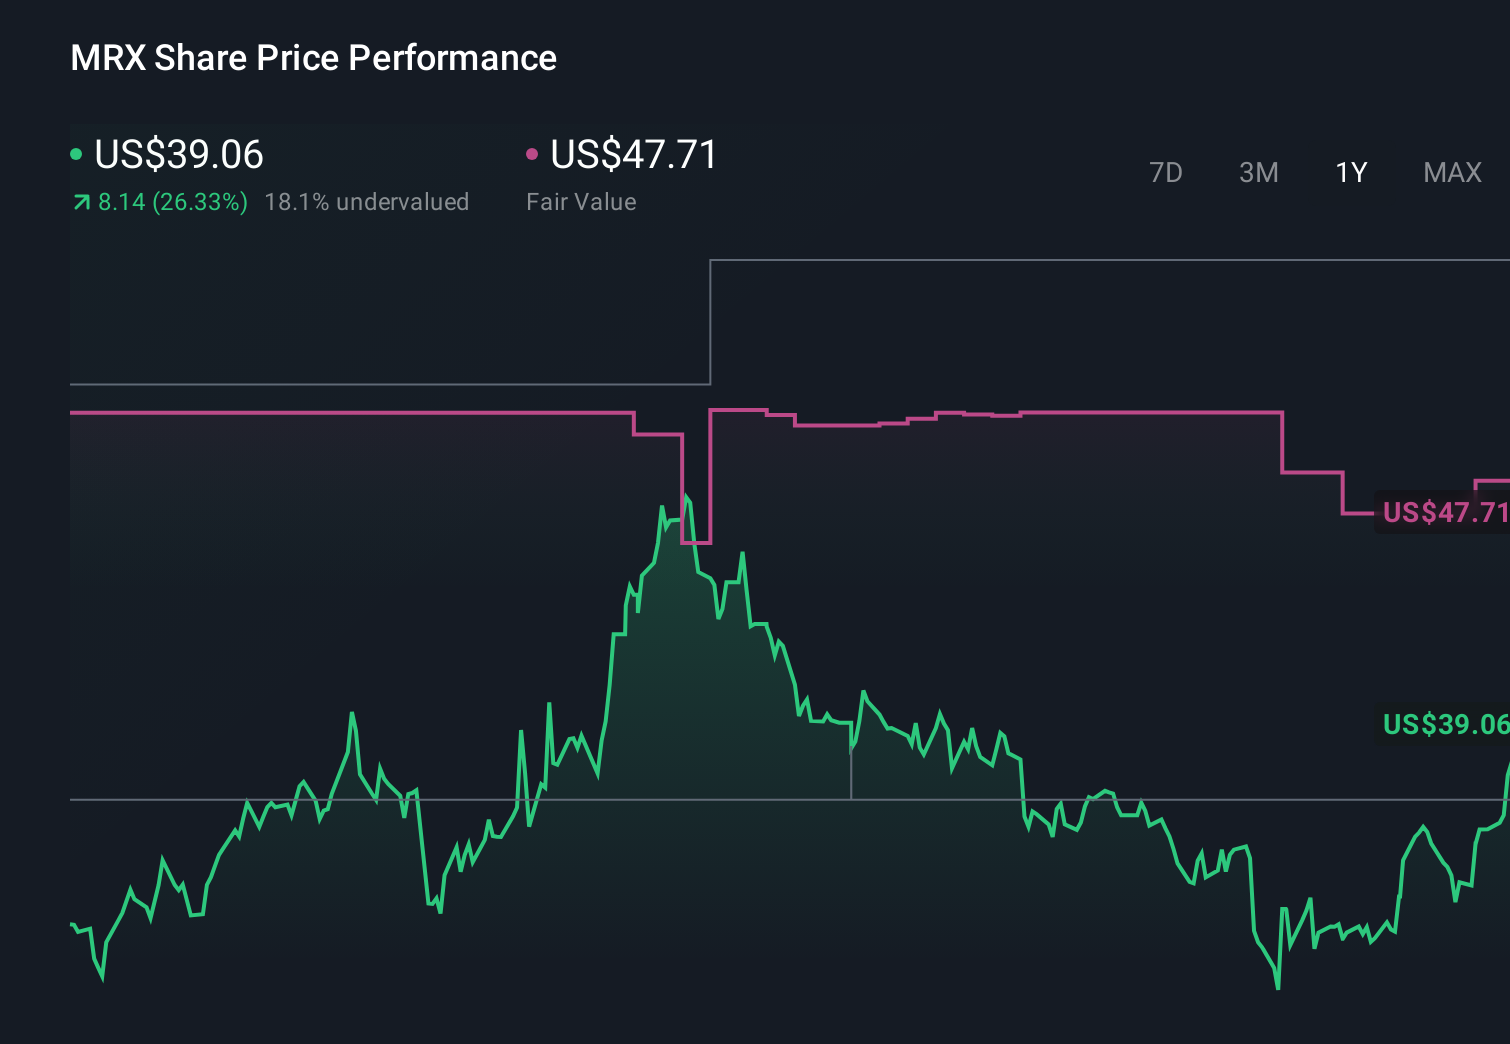
- The stock has logged returns of 2.5% over the last 7 days, 4.4% over 30 days, 6.7% year to date and 12.0% over the past year. This naturally raises questions about what is already priced in and how much risk the market is assuming.
- Recent news coverage around Marex Group has focused on its role in diversified financials and how investors are treating the stock within that sector. This helps frame these recent price moves and provides a useful backdrop for asking whether current expectations line up with a reasonable estimate of underlying worth.
- Marex Group currently holds a valuation score of 5/6, with one point awarded for each of the six checks where the shares appear undervalued. Next, we will walk through the main valuation methods behind that score, followed by a more holistic way to think about what the market might be missing.
Approach 1: Marex Group Excess Returns Analysis
The Excess Returns model looks at how much profit a company is expected to earn above the return that equity investors typically require. Instead of focusing on cash flows, it starts with what shareholders have invested, then asks whether future earnings on that equity justify today’s share price.
For Marex Group, the model uses a Book Value of about $15.09 per share and a Stable EPS of $3.68 per share, based on the median return on equity over the past 5 years. The implied Cost of Equity is $2.18 per share, which leads to an Excess Return of $1.50 per share. That sits on top of an Average Return on Equity of 16.92% and a Stable Book Value assumption of $21.73 per share, informed by weighted future book value estimates from 2 analysts.
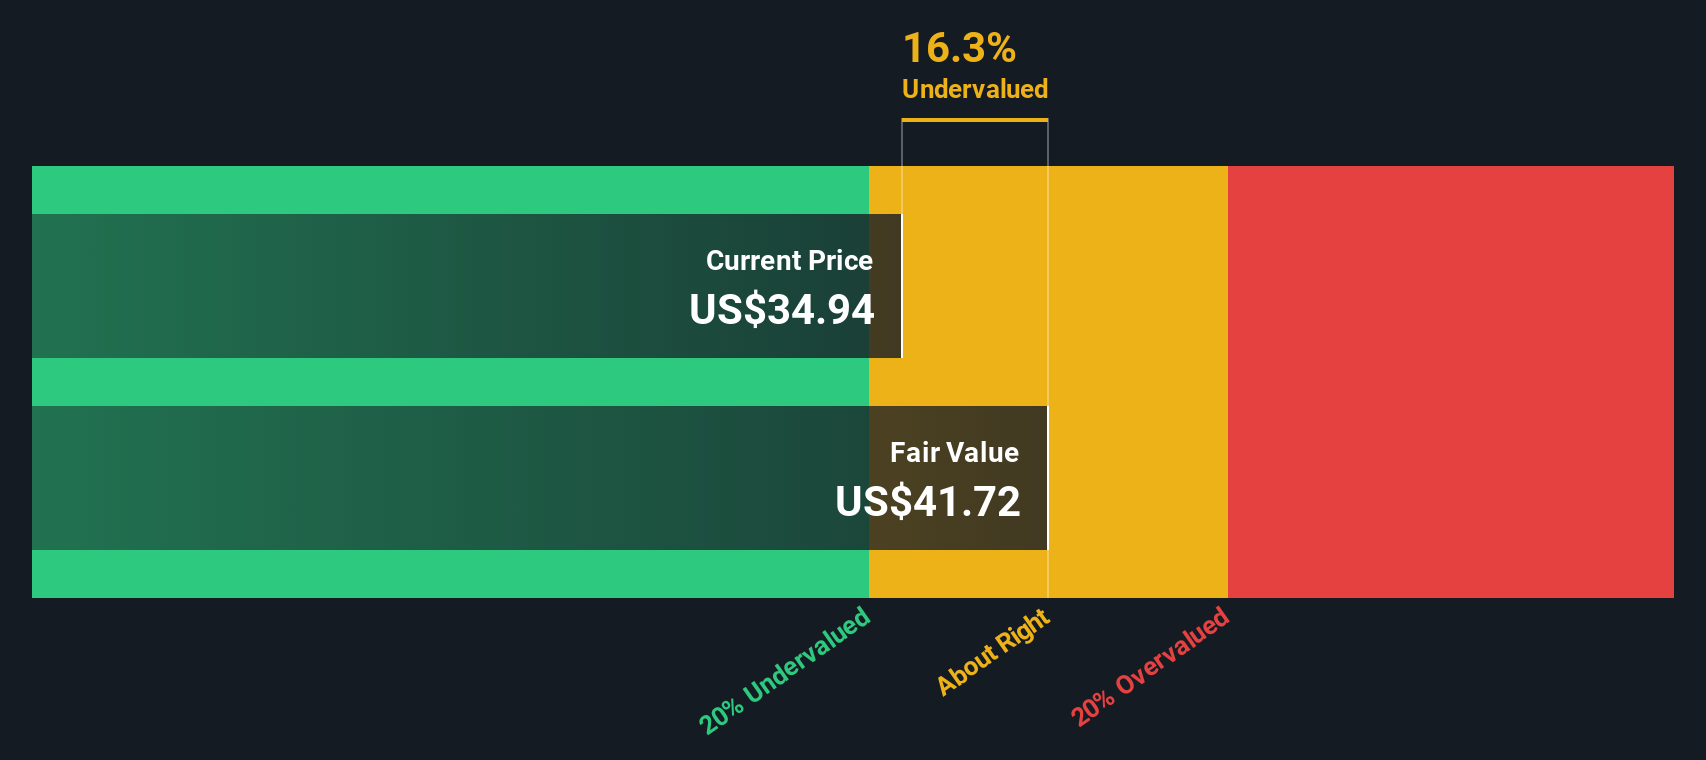
Feeding these inputs into the Excess Returns framework produces an estimated intrinsic value of around $44.39 per share. Compared with the current price of roughly $40.48, the model suggests Marex Group is about 8.8% undervalued, which is a relatively small gap.
Result: ABOUT RIGHT
Marex Group is fairly valued according to our Excess Returns, but this can change at a moment's notice. Track the value in your watchlist or portfolio and be alerted on when to act.
Approach 2: Marex Group Price vs Earnings
For a profitable company like Marex Group, the P/E ratio is a useful way to see how much investors are paying for each dollar of earnings. It ties the share price directly to what the business is currently earning, which makes it easier to compare against other stocks and broad benchmarks.
What counts as a “normal” P/E really depends on how the market views growth potential and risk. Higher expected growth or perceived resilience can justify a higher multiple, while more uncertainty or lower growth usually calls for a lower one.
Marex Group currently trades on a P/E of 10.92x. That sits below the Capital Markets industry average of 23.14x and also below the peer average of 16.24x. Simply Wall St’s Fair Ratio for Marex Group is 15.84x, which is its proprietary view of what a reasonable P/E might be given factors such as earnings growth, industry, profit margins, market cap and risk profile.
The Fair Ratio aims to be more tailored than a simple peer or industry comparison because it adjusts for those company specific drivers instead of assuming that all capital markets firms deserve the same multiple. Comparing 10.92x to the Fair Ratio of 15.84x points to Marex Group trading below that customised reference point.
Result: UNDERVALUED

P/E ratios tell one story, but what if the real opportunity lies elsewhere? Start investing in legacies, not executives. Discover our 22 top founder-led companies.
Upgrade Your Decision Making: Choose your Marex Group Narrative
Earlier we mentioned that there is an even better way to understand valuation. Let us introduce you to Narratives, which simply means writing the story behind your numbers for Marex Group, including what you think is a fair value and how revenue, earnings and margins might evolve from here.
A Narrative links what you believe about the business to a clear financial forecast and then to a fair value, so you are not just looking at a P/E or a model output in isolation.
On Simply Wall St, Narratives are an easy tool within the Community page, where millions of investors can set their own assumptions, compare the resulting fair value to the current share price and decide whether Marex Group looks attractive, fully priced or expensive based on that personal view.
Narratives also update automatically when fresh information, such as news or earnings, is added to the platform. You might see one Marex Group Narrative that assumes a relatively high fair value because it expects stronger profitability, and another that sets a much lower fair value because it assumes more muted margins and uses a higher discount rate.
Do you think there's more to the story for Marex Group? Head over to our Community to see what others are saying!
This article by Simply Wall St is general in nature. We provide commentary based on historical data and analyst forecasts only using an unbiased methodology and our articles are not intended to be financial advice. It does not constitute a recommendation to buy or sell any stock, and does not take account of your objectives, or your financial situation. We aim to bring you long-term focused analysis driven by fundamental data. Note that our analysis may not factor in the latest price-sensitive company announcements or qualitative material. Simply Wall St has no position in any stocks mentioned.
Have feedback on this article? Concerned about the content? Get in touch with us directly. Alternatively, email editorial-team@simplywallst.com