
- LIVE QUOTES
- LEARN
- HELP
 Nasdaq
 Wall Street Journal
EN
GrafTech International (EAF) Losses Deepen With US$219.8 Million TTM Hit Challenging Bullish Growth Narrative
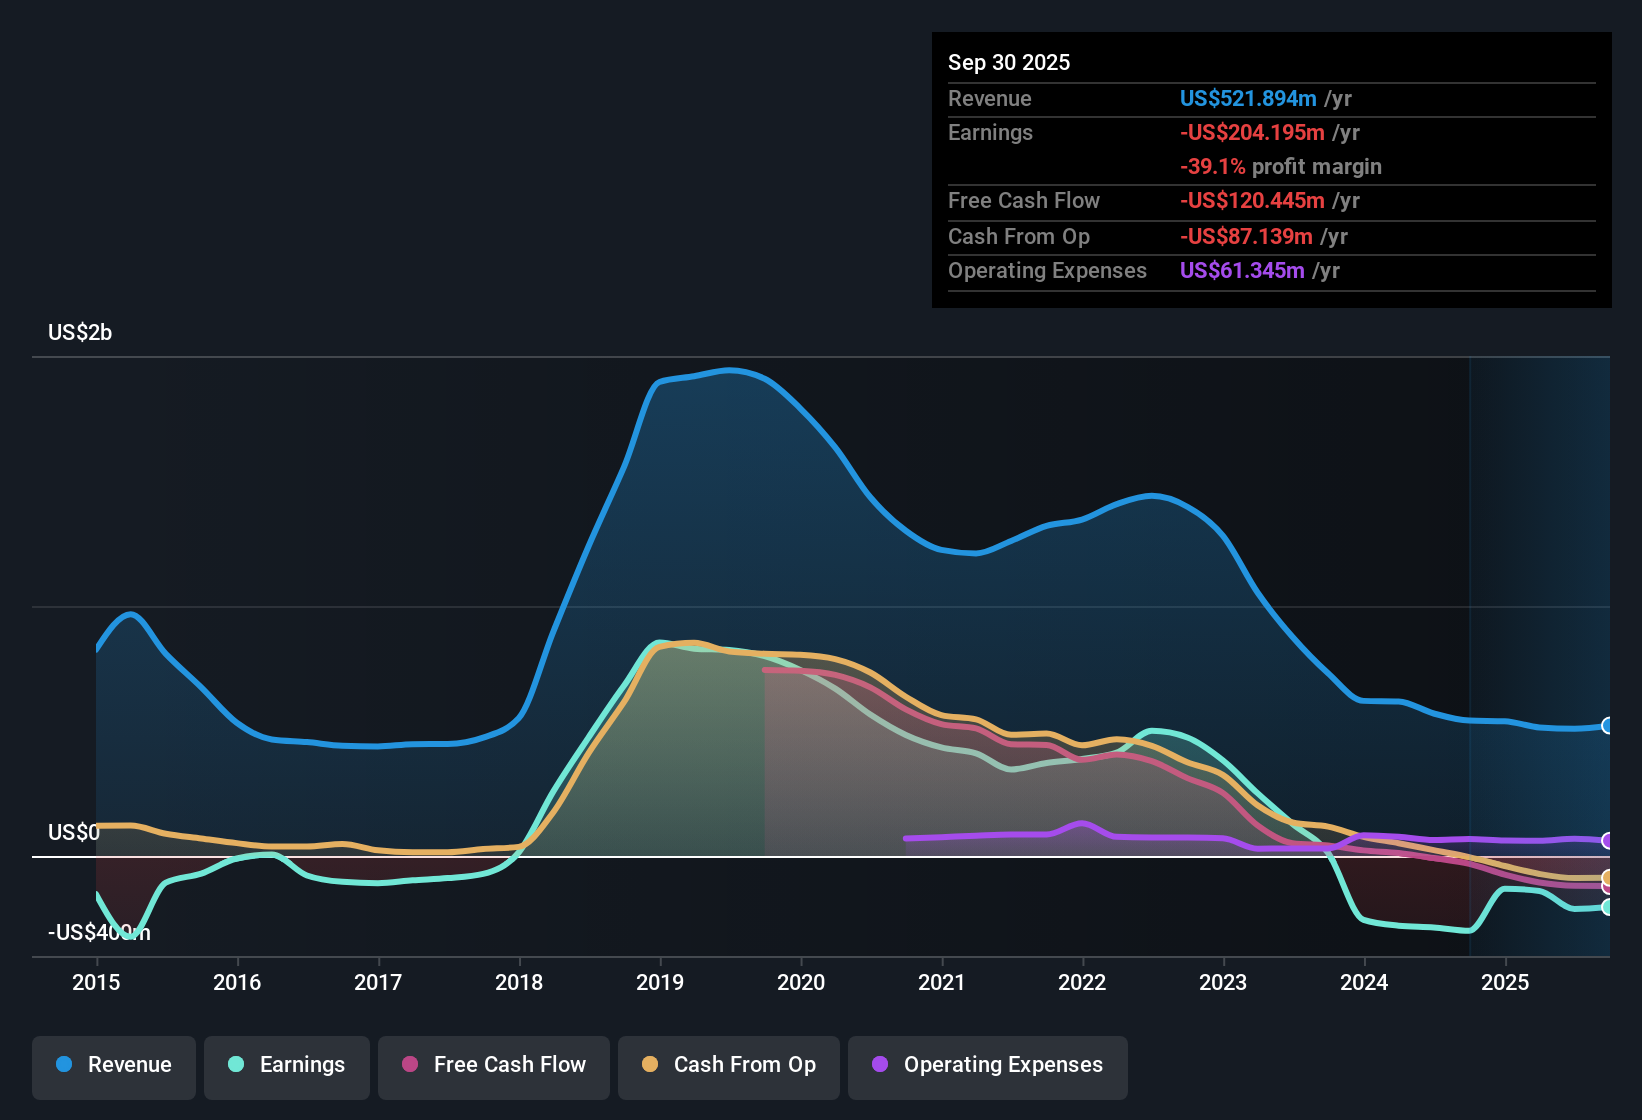
GrafTech International (EAF) closed out FY 2025 with Q4 revenue of US$116.5 million and a basic EPS loss of US$2.50, alongside a trailing twelve month revenue base of US$504.1 million and an EPS loss of US$8.45. The company has seen quarterly revenue move between US$111.8 million and US$144.0 million over the 2025 fiscal year, while quarterly EPS losses ranged from US$1.10 to US$3.35. This has left margins under clear pressure for shareholders watching the path back toward profitability.
See our full analysis for GrafTech International.With the numbers on the table, the next step is to set these results against the widely followed narratives around GrafTech's growth prospects, risks, and expectations to see which stories hold up and which start to crack.
Curious how numbers become stories that shape markets? Explore Community Narratives
TTM Losses Of US$219.8 Million Keep Profit Pressure High
- Over the last twelve months, GrafTech booked total revenue of US$504.1 million against a net loss of US$219.8 million, and EPS over that same period came in at a loss of US$8.45.
- Critics highlight a bearish picture where losses have been growing at about 59.9% per year over the past five years, and the latest four quarters line up with that concern, with every single quarter in FY 2025 showing net losses between US$28.5 million and US$86.9 million.
- This pattern of quarterly net losses ties in with the view that GrafTech is expected to remain unprofitable for at least the next three years, so the recent track record does not yet point to an earnings turn.
- With TTM EPS at a loss of US$8.45 and no profitable quarter in the supplied data, the bearish focus on persistent loss making is firmly backed by the reported figures.
Revenue Near US$504 Million Versus 13.1% Growth Outlook
- The trailing twelve month revenue base of US$504.1 million is paired with a revenue growth forecast of about 13.1% per year, which is higher than the 10.2% per year forecast cited for the broader US market.
- Supporters of a more bullish angle point out that a forecast 13.1% revenue growth rate against this US$504.1 million starting point suggests a business with growing top line. However, the same data set shows no profitability so far, which means the bullish focus on growth has to be weighed against the ongoing losses of more than US$200 million over the last twelve months.
- The contrast between a higher than market growth forecast and a TTM net loss of US$219.8 million is what keeps the bullish case very dependent on how efficiently that future revenue is converted into earnings.
- Because revenue in each FY 2025 quarter held in a band of roughly US$111.8 million to US$144.0 million while losses persisted, the growth argument is supported on the sales side but not yet matched by progress on profitability in the reported numbers.
Low 0.4x P/S Against Industry While Balance Sheet Flags Remain
- GrafTech trades on a P/S of about 0.4x, compared with 2.3x for the US Electrical industry and 2.2x for peers, at the same time as the company carries negative shareholders’ equity and debt that is not well covered by operating cash flow, with the share price at US$8.44.
- Bears argue that the apparently low 0.4x P/S ratio is explained by balance sheet and earnings risk rather than mispricing, and the supplied metrics support that angle because you have negative equity, weak debt coverage by operating cash flow, and a TTM loss of US$219.8 million all sitting behind that US$8.44 share price.
- The combination of negative shareholders’ equity and ongoing losses gives critics a concrete reason to say the discount to the 2.3x industry P/S multiple is tied to financial strength concerns rather than just market pessimism.
- Higher share price volatility over the past three months versus the US market adds another factual point for the bearish case that investors are pricing in extra risk around this capital structure.
Next Steps
Don't just look at this quarter; the real story is in the long-term trend. We've done an in-depth analysis on GrafTech International's growth and its valuation to see if today's price is a bargain. Add the company to your watchlist or portfolio now so you don't miss the next big move.
See What Else Is Out There
GrafTech is dealing with steady revenue, significant twelve month losses of US$219.8 million, negative equity and balance sheet pressure that keeps risk perceptions high.
If that mix of ongoing losses and fragile finances feels uncomfortable, you may want to focus on companies with sturdier fundamentals. Use our solid balance sheet and fundamentals stocks screener (45 results) to quickly find ideas with stronger financial bases.
This article by Simply Wall St is general in nature. We provide commentary based on historical data and analyst forecasts only using an unbiased methodology and our articles are not intended to be financial advice. It does not constitute a recommendation to buy or sell any stock, and does not take account of your objectives, or your financial situation. We aim to bring you long-term focused analysis driven by fundamental data. Note that our analysis may not factor in the latest price-sensitive company announcements or qualitative material. Simply Wall St has no position in any stocks mentioned.
Have feedback on this article? Concerned about the content? Get in touch with us directly. Alternatively, email editorial-team@simplywallst.com