
- LIVE QUOTES
- LEARN
- HELP
 Nasdaq
 Wall Street Journal
EN
Is It Too Late To Consider Sterling Infrastructure (STRL) After A 168% One Year Surge?
- If you are looking at Sterling Infrastructure and wondering whether the recent share price reflects its underlying value, this article will walk through what the current numbers actually say.
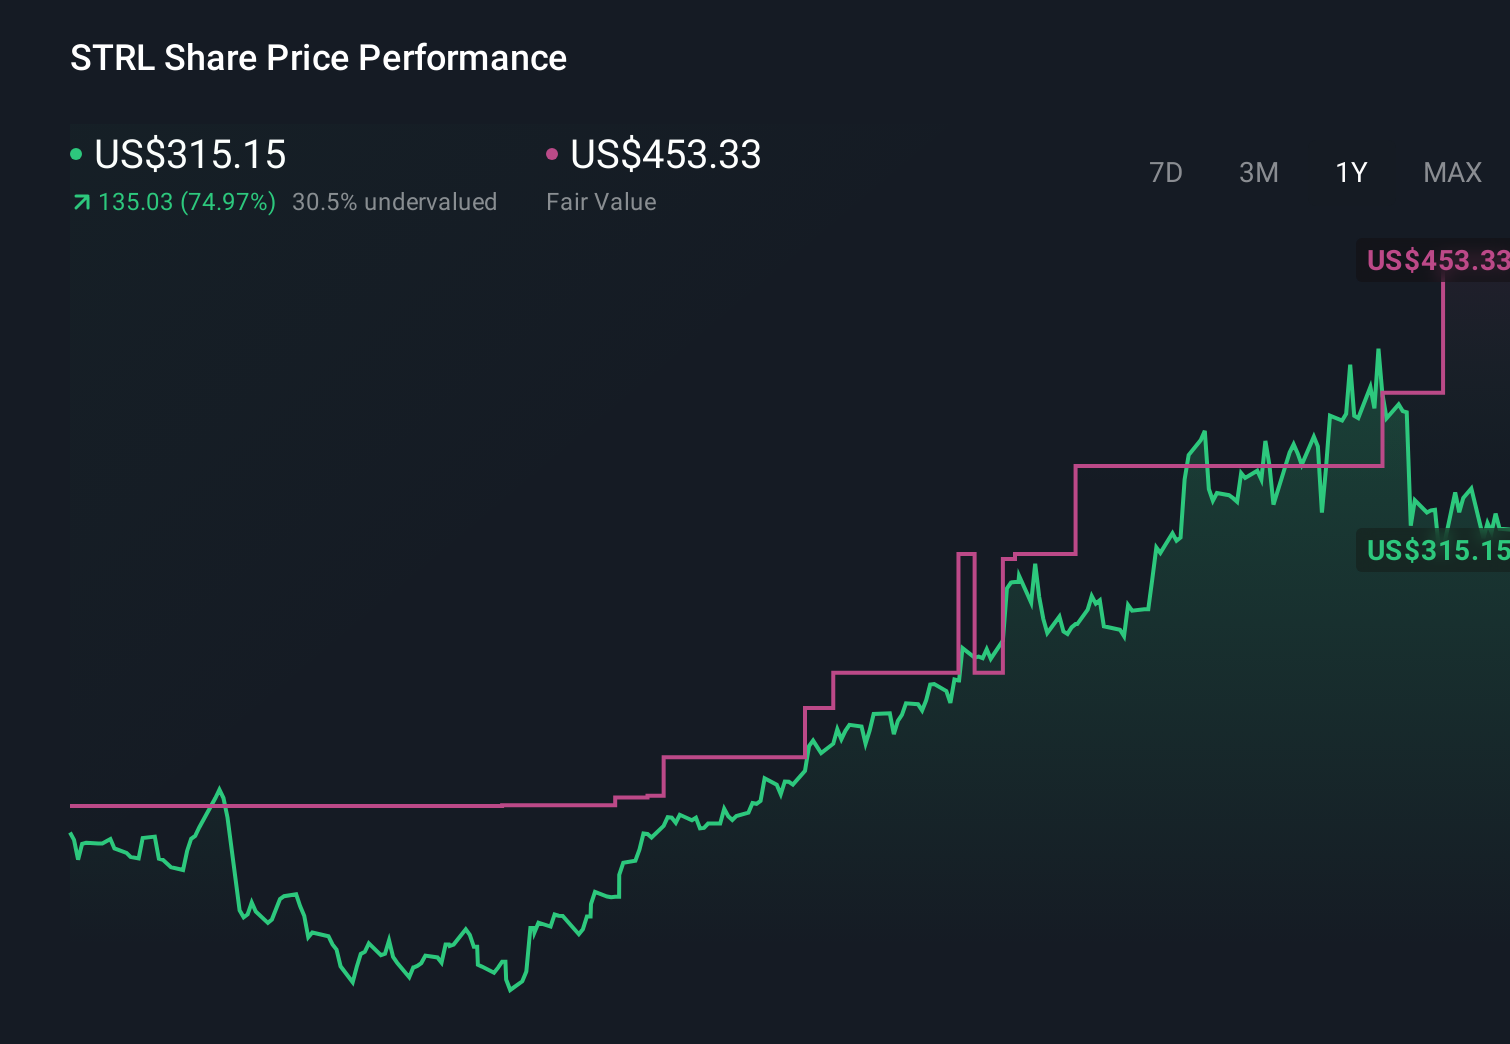
- The stock last closed at US$401.29, with returns of 12.1% over 7 days, 28.5% over 30 days, 25.7% year to date and 168.0% over the last year. The 3 year and 5 year returns are also very large.
- Recent news coverage has focused on Sterling Infrastructure as an infrastructure and construction related business that has attracted growing investor attention. Commentary often points to its long term share price performance and position within the capital goods space. This context helps explain why some investors are now asking whether the current valuation still lines up with the fundamentals.
- Our valuation checks currently give Sterling Infrastructure a score of 0 out of 6, so we will look at what different valuation approaches are indicating, and finish with a more holistic way to think about what this means for you.
Sterling Infrastructure scores just 0/6 on our valuation checks. See what other red flags we found in the full valuation breakdown.
Approach 1: Sterling Infrastructure Discounted Cash Flow (DCF) Analysis
A Discounted Cash Flow, or DCF, model estimates what a company might be worth by projecting its future cash flows and then discounting those back to today using a required return. It is essentially asking what all those future dollars are worth in your hand right now.
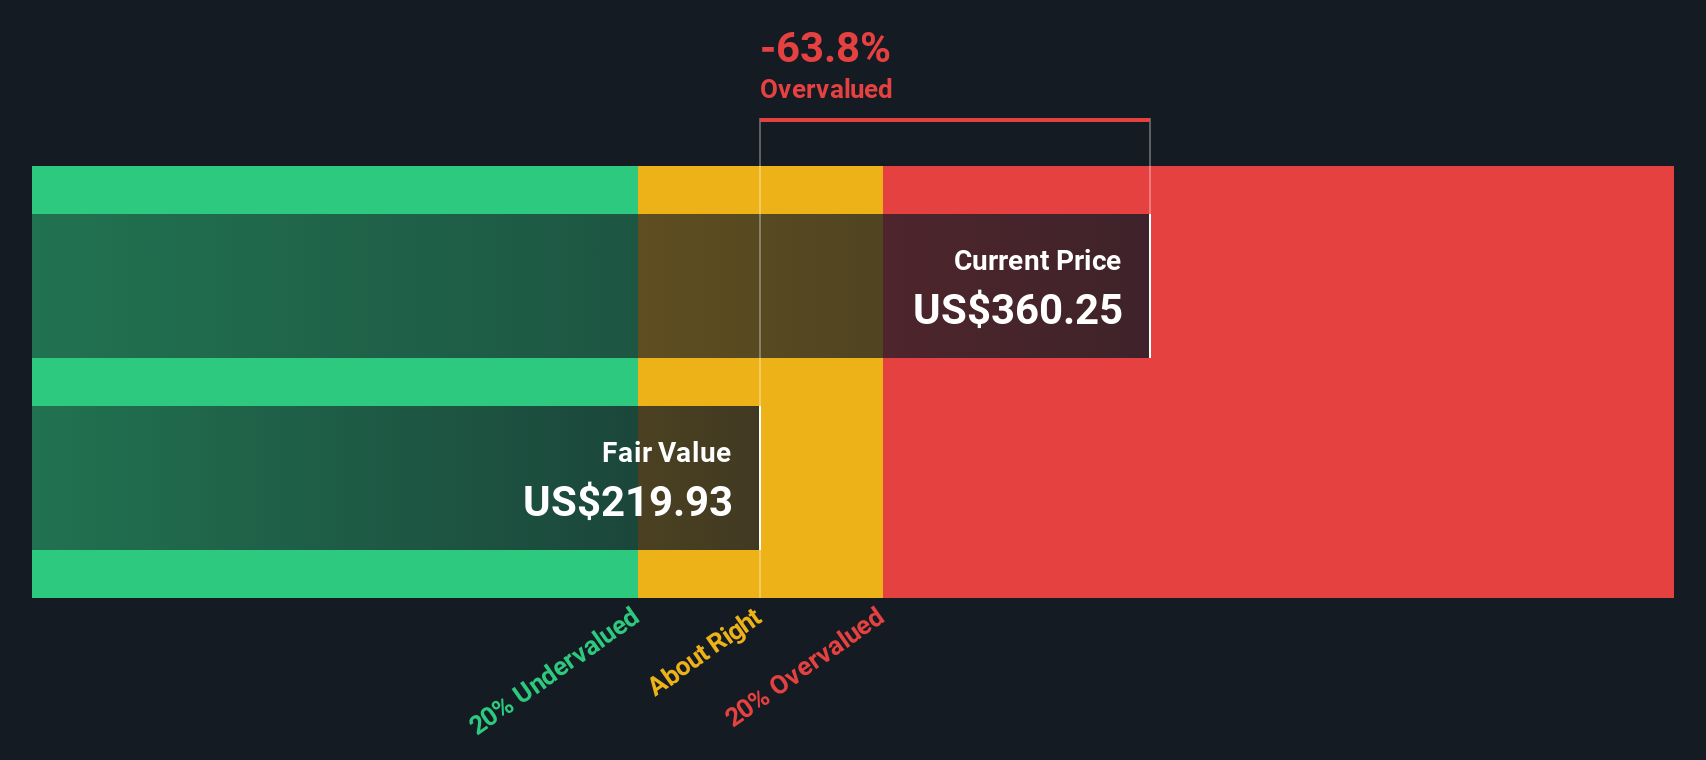
For Sterling Infrastructure, the model used is a 2 Stage Free Cash Flow to Equity approach based on cash flow projections. The latest twelve month free cash flow is about $353.7 million. Analyst estimates and extrapolations used in the model project free cash flow reaching about $530.8 million in 2035, with interim projections such as $410.1 million in 2026 and $484 million in 2030, all in $ terms. Simply Wall St only has analyst inputs for the nearer years, with later years extrapolated from those inputs.
When these projected cash flows are discounted back, the DCF output suggests an estimated intrinsic value of about $257.91 per share. Compared with the recent share price of $401.29, this implies the stock is about 55.6% overvalued on this model.
Result: OVERVALUED
Our Discounted Cash Flow (DCF) analysis suggests Sterling Infrastructure may be overvalued by 55.6%. Discover 53 high quality undervalued stocks or create your own screener to find better value opportunities.
Approach 2: Sterling Infrastructure Price vs Earnings
For a profitable company like Sterling Infrastructure, the P/E ratio is a useful way to see how much you are paying for each dollar of earnings. A higher P/E can reflect higher growth expectations or lower perceived risk, while a lower P/E can point to lower growth expectations or higher risk.
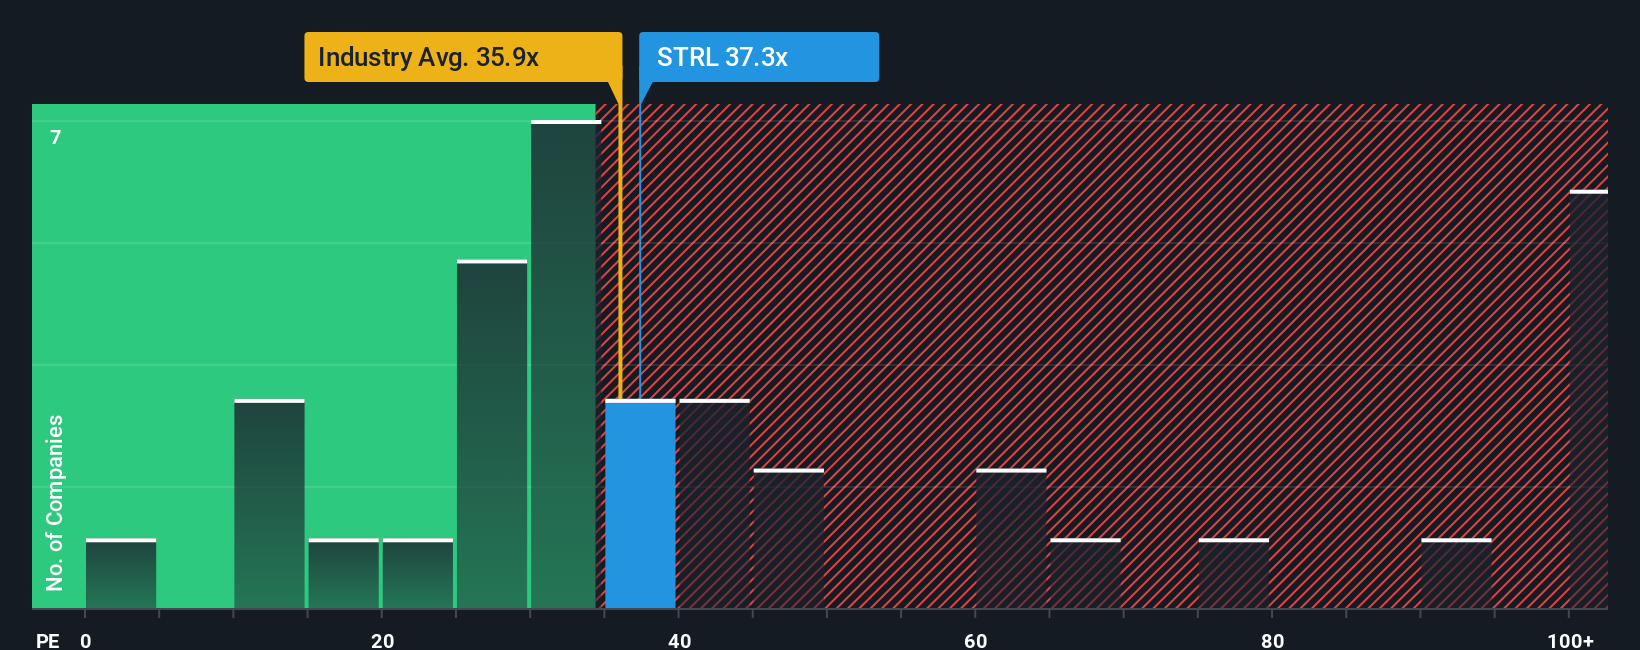
Sterling Infrastructure currently trades on a P/E of 39.0x. That sits slightly above the Construction industry average P/E of 38.3x and above the peer group average of 29.7x. Simply Wall St also calculates a Fair Ratio of 36.0x for Sterling Infrastructure. This is the P/E level the model suggests based on factors such as the company’s earnings growth profile, its industry, profit margins, market cap and risk characteristics.
The Fair Ratio is more tailored than a simple peer or industry comparison because it adjusts for company specific traits instead of assuming all Construction names deserve the same multiple. Comparing the current 39.0x P/E with the 36.0x Fair Ratio points to Sterling Infrastructure trading somewhat above the level implied by these fundamentals.
Result: OVERVALUED
P/E ratios tell one story, but what if the real opportunity lies elsewhere? Start investing in legacies, not executives. Discover our 22 top founder-led companies.
Upgrade Your Decision Making: Choose your Sterling Infrastructure Narrative
Earlier we mentioned that there is an even better way to understand valuation, so let us introduce you to Narratives, a simple tool that connects your view of Sterling Infrastructure’s story to the numbers behind it.
A Narrative on Simply Wall St is your own storyline for a company. You set what you think is a fair value and outline your expectations for future revenue, earnings and margins, rather than only accepting a single model output.
This story is then linked directly to a financial forecast and a fair value estimate. You can compare this with the current share price to help you decide whether Sterling Infrastructure looks attractive, fairly priced or expensive for your approach.
You can create and explore these Narratives on the Simply Wall St Community page, which is used by millions of investors. They update automatically when new information such as news or earnings is added so your view stays current without extra effort.
For Sterling Infrastructure, one investor might build a Narrative that assumes more conservative growth and arrives at a fair value well below today’s price. Another might expect stronger execution and assign a fair value closer to or above the current market level.
Do you think there's more to the story for Sterling Infrastructure? Head over to our Community to see what others are saying!
This article by Simply Wall St is general in nature. We provide commentary based on historical data and analyst forecasts only using an unbiased methodology and our articles are not intended to be financial advice. It does not constitute a recommendation to buy or sell any stock, and does not take account of your objectives, or your financial situation. We aim to bring you long-term focused analysis driven by fundamental data. Note that our analysis may not factor in the latest price-sensitive company announcements or qualitative material. Simply Wall St has no position in any stocks mentioned.
Have feedback on this article? Concerned about the content? Get in touch with us directly. Alternatively, email editorial-team@simplywallst.com