
- LIVE QUOTES
- LEARN
- HELP
 Nasdaq
 Wall Street Journal
EN
Arrow Electronics (ARW) Earnings Surge 45.7% Challenges Low P/E Narrative
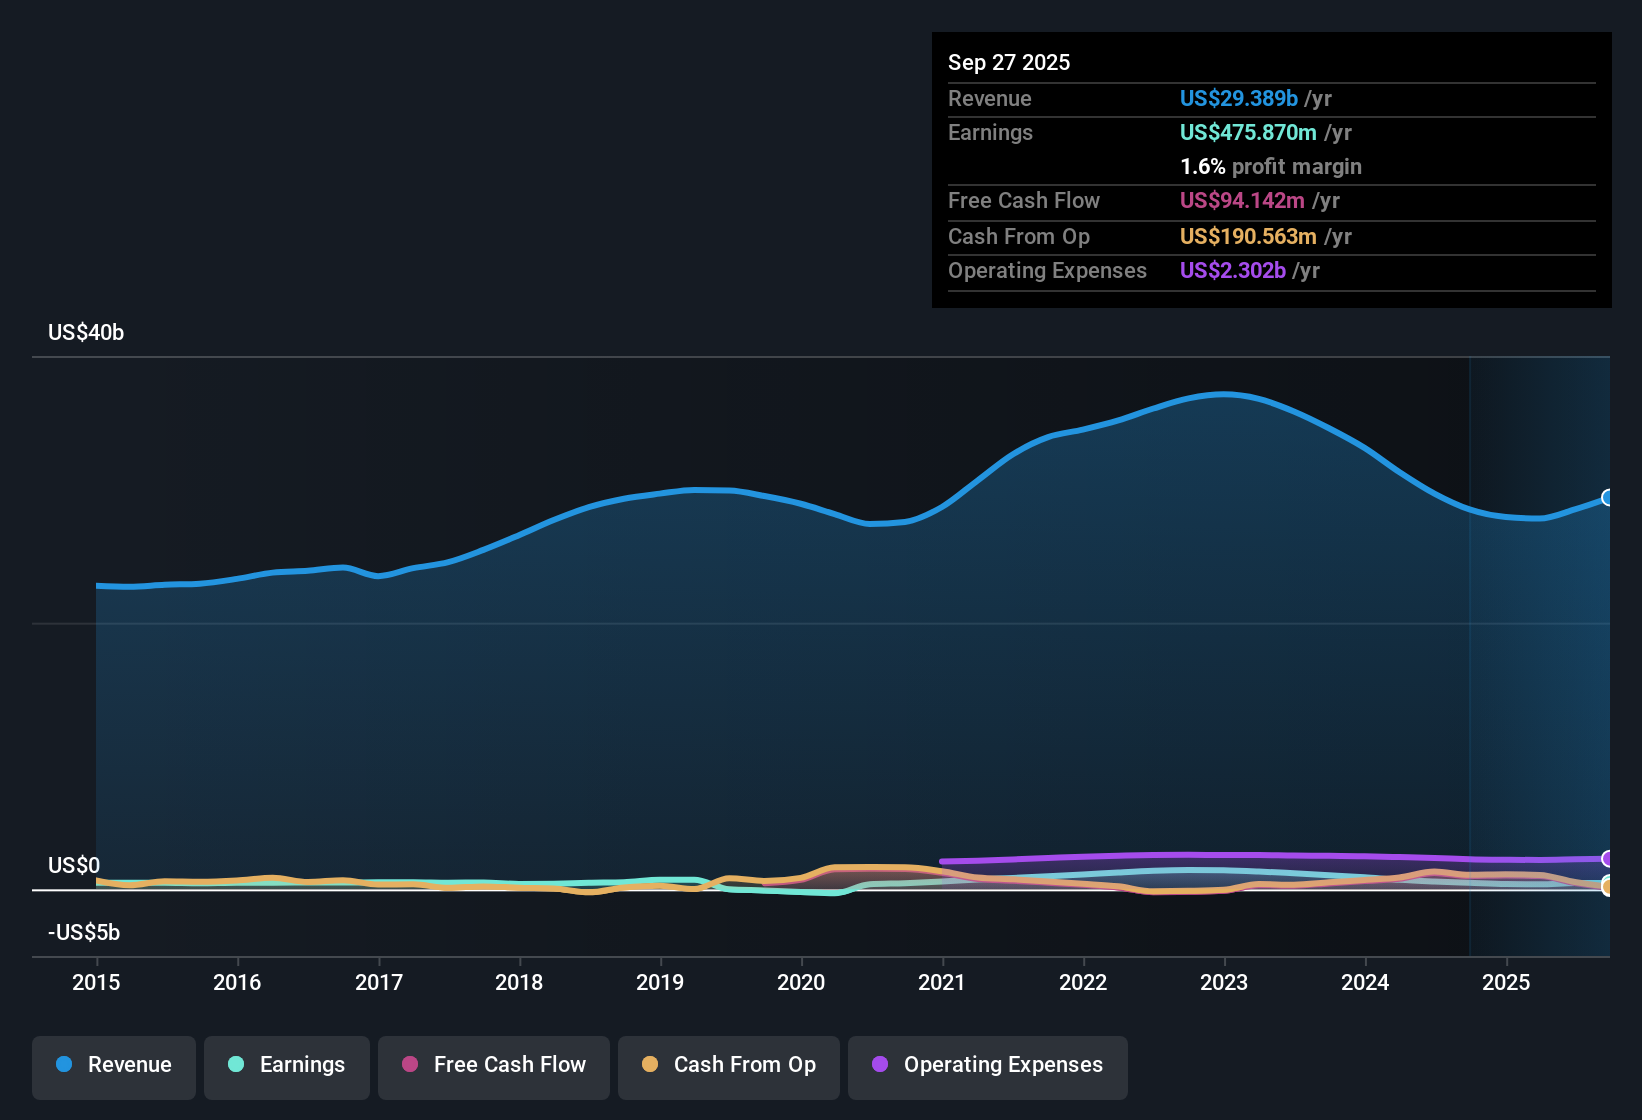
Arrow Electronics (ARW) has wrapped up FY 2025 with fourth quarter revenue of US$8.7b and basic EPS of US$3.78. This capped a trailing twelve month run that saw revenue at US$30.9b and EPS at US$11.03. The company has seen revenue move from US$7.3b and EPS of US$1.88 in Q4 2024 to US$8.7b and EPS of US$3.78 in Q4 2025, with trailing twelve month EPS moving from US$7.36 at Q4 2024 to US$11.03 at Q4 2025. With earnings over the last year up 45.7% and net profit margin at 1.9%, investors are likely to focus on how much of this profitability pickup looks durable.
See our full analysis for Arrow Electronics.With the headline numbers on the table, the next step is to set these results against the most common market narratives around Arrow Electronics and see which stories the latest margins and earnings actually support.
Curious how numbers become stories that shape markets? Explore Community Narratives
45.7% earnings lift with 1.9% margin
- Over the last 12 months, Arrow generated US$571.3 million of net income on US$30.9b of revenue, which works out to a 1.9% net margin and ties to the 45.7% earnings growth figure you saw earlier.
- What stands out for a bullish take is that this 1.9% margin and 45.7% trailing earnings growth sit against a five year pattern of earnings declining about 14.7% per year, so anyone arguing that the latest year marks a clean turning point needs to square that with the longer track record.
- Supporters can point to the last two reported quarters, where net income was US$194.6 million on US$8.7b of Q4 2025 revenue and US$187.7 million on US$7.6b of Q2 2025 revenue, as evidence that recent profitability is not just a single quarter blip.
- On the other hand, the fact that trailing 12 month net income of US$571.3 million is only modestly ahead of the US$487.4 million level seen at Q3 2024 shows the improvement has been meaningful but still within a relatively low margin business model.
P/E at 14.2x versus higher peers
- Arrow trades on a trailing P/E of 14.2x compared with roughly 19.3 to 19.6x for the broader US market and 26.2x for the US electronic industry, so the current share price of US$158.60 implies a lower multiple than many peers on the same earnings base.
- What is interesting for bullish investors is how this valuation gap sits alongside the recent earnings pickup, as the company pairs that 14.2x P/E with US$11.03 of trailing EPS and a 45.7% year over year earnings lift, which some may see as misaligned with the discount to sector averages.
- Supporters of the bullish angle can point out that trailing 12 month revenue is US$30.9b, only slightly above the US$27.9b to US$28.5b range seen through late 2024, yet the stronger earnings outcome has not been matched by a peer level multiple.
- Critics of the bullish case may counter that forecasts for roughly 3.8% annual earnings growth and about 5% annual revenue growth are described as moderate and below broader US market expectations, which could help explain why the market is comfortable with a 14.2x multiple instead of paying in line with industry averages.
Bulls and skeptics are both watching how long this mix of a 14.2x P/E, US$11.03 of trailing EPS, and 45.7% earnings growth can hold before expectations reset one way or the other, and that kind of tension is exactly what longer form narratives try to unpack, from assumptions about margin stability to views on where valuation should settle relative to peers. Curious how numbers become stories that shape markets? Explore Community Narratives
Debt coverage risk despite higher profits
- Alongside the stronger income statement, one of the clearest flags in the latest 12 month view is that debt is described as not being well covered by operating cash flow, which sits uncomfortably next to US$571.3 million of trailing net income and a 1.9% margin.
- Critics taking a bearish stance lean on this leverage concern and the longer term earnings record, arguing that the 45.7% earnings improvement could be harder to rely on when five year earnings have declined around 14.7% per year and operating cash flow has not covered debt, so they see the recent profit strength as needing to be tested against cash generation rather than earnings alone.
- The contrast between the weak debt coverage signal and the US$30.9b of trailing 12 month revenue encourages a closer look at how much of that top line actually converts into cash that can service obligations.
- At the same time, forecasts for roughly 3.8% annual earnings growth and 5% annual revenue growth are described as moderate, which bears may argue does not leave a wide cushion if cash flow remains tight relative to debt.
Next Steps
Don't just look at this quarter; the real story is in the long-term trend. We've done an in-depth analysis on Arrow Electronics's growth and its valuation to see if today's price is a bargain. Add the company to your watchlist or portfolio now so you don't miss the next big move.
See What Else Is Out There
Arrow Electronics combines a low 1.9% margin and relatively weak debt coverage with a longer-term record of earnings contracting about 14.7% per year.
If that mix of thin margins and debt coverage risk makes you cautious, you might want to shift your focus toward companies with stronger cash support by checking out solid balance sheet and fundamentals stocks screener (45 results) right now.
This article by Simply Wall St is general in nature. We provide commentary based on historical data and analyst forecasts only using an unbiased methodology and our articles are not intended to be financial advice. It does not constitute a recommendation to buy or sell any stock, and does not take account of your objectives, or your financial situation. We aim to bring you long-term focused analysis driven by fundamental data. Note that our analysis may not factor in the latest price-sensitive company announcements or qualitative material. Simply Wall St has no position in any stocks mentioned.
Have feedback on this article? Concerned about the content? Get in touch with us directly. Alternatively, email editorial-team@simplywallst.com