
- LIVE QUOTES
- LEARN
- HELP
 Nasdaq
 Wall Street Journal
EN
Sun Country Airlines Holdings (SNCY) Margin Slippage Challenges Bullish Profitability Narratives
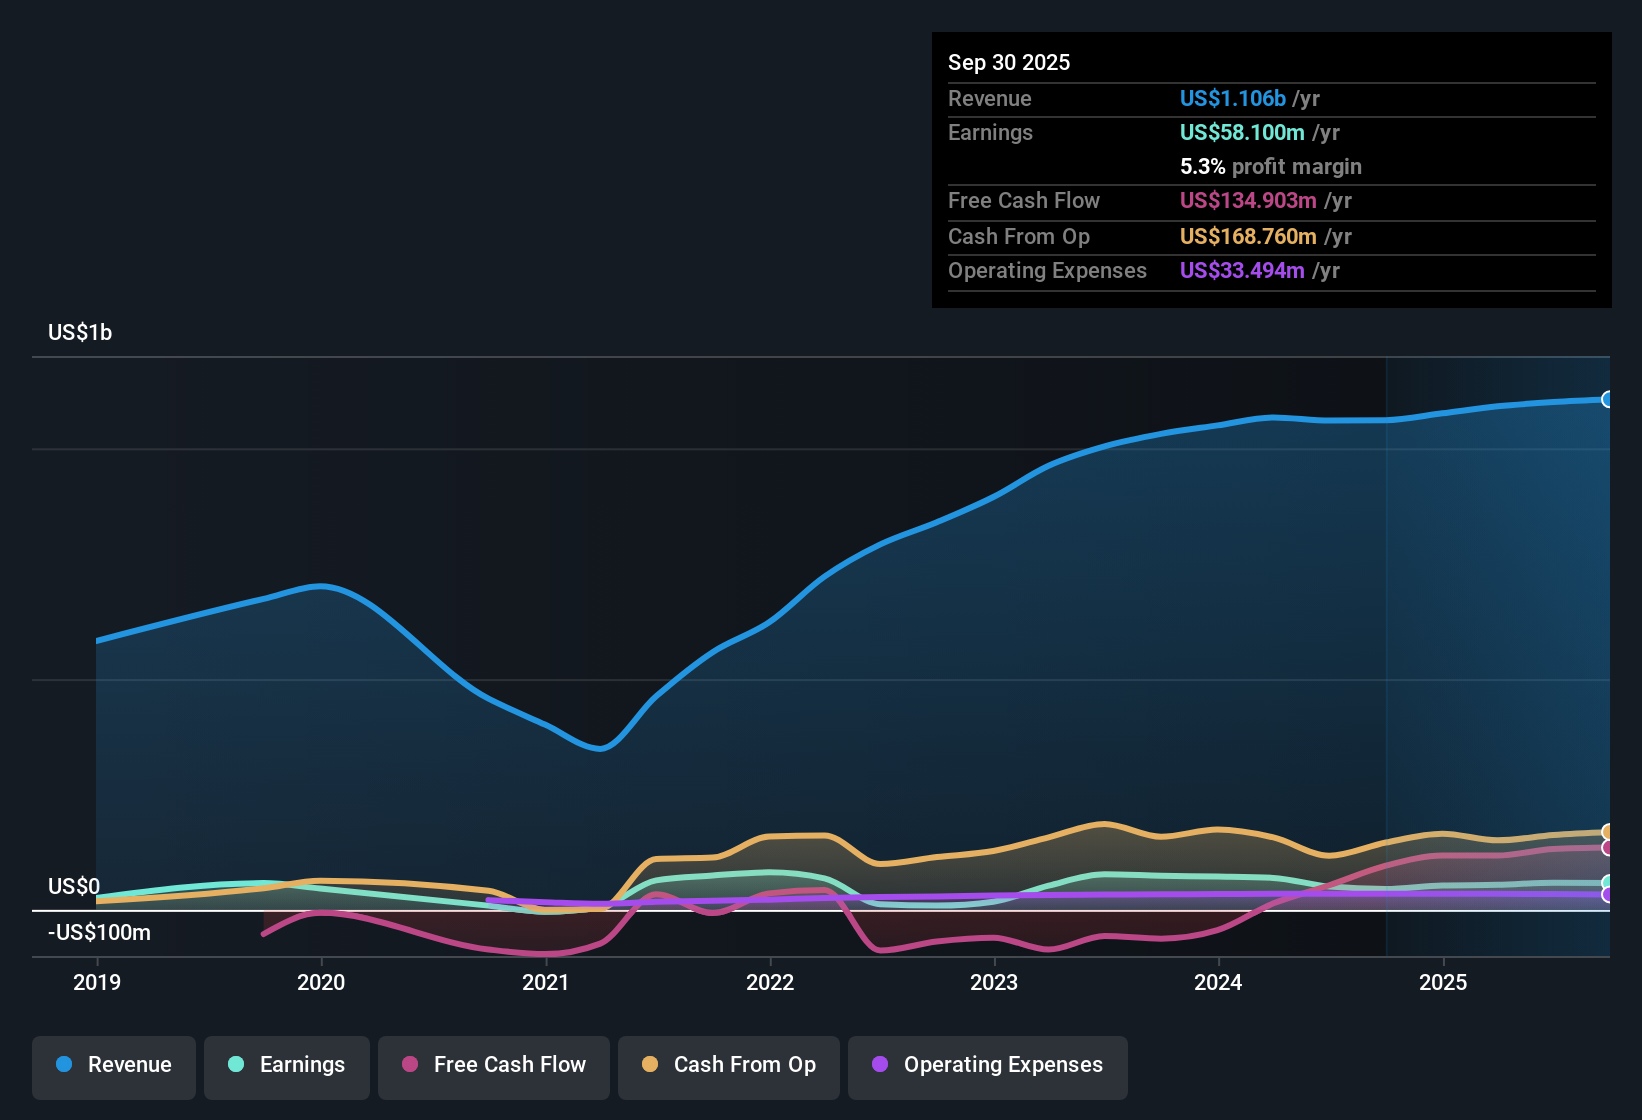
Sun Country Airlines Holdings (SNCY) just wrapped up FY 2025 with Q4 revenue of US$281 million and basic EPS of US$0.15, alongside trailing twelve month revenue of US$1.13 billion and EPS of US$0.99 that frame the full year picture. Over the past year, the company has seen revenue move from US$1.08 billion and EPS of US$1.00 on a trailing basis in Q4 FY 2024 to US$1.13 billion and EPS of US$0.99 in Q4 FY 2025, giving investors a clear line of sight on how the top line and per share earnings have tracked into this latest release. With a current net profit margin of 4.7% compared to 4.9% a year earlier, the focus shifts to how investors weigh slightly softer margins against the broader growth drivers behind these results.
See our full analysis for Sun Country Airlines Holdings.With the headline numbers on the table, the next step is to weigh them against the prevailing market narratives around Sun Country, to see which stories hold up under the data and which ones start to look out of sync.
Curious how numbers become stories that shape markets? Explore Community Narratives
Q4 profit of US$8.1 million on US$281 million revenue
- For Q4 FY 2025, Sun Country reported US$280.96 million in revenue and net income of US$8.15 million, while the trailing twelve months show US$1.13b in revenue and US$52.81 million in net income.
- What stands out for a bullish view is that the company stayed profitable across the year, with trailing EPS at US$0.99 and net profit margin at 4.7%. Yet:
- that 4.7% margin is slightly below last year’s 4.9%, so anyone optimistic on the stock has to account for margins not widening in the latest data.
- the Q4 EPS of US$0.15 compares with US$0.25 in Q4 FY 2024, which prompts questions about how consistent quarterly profitability might be, even if the full year stayed in the black.
Passenger metrics show mixed signals
- Across FY 2025, passenger load factor moved between 81.8% and 84.8%, with revenue yield per available seat kilometer ranging from US$8.59 to US$9.10, while available seat kilometers were as high as 3,785.16 million in Q1 and 2,808.43 million in Q3.
- Supporters of a bullish angle often look for solid usage of capacity, and here:
- load factors above 80% in each reported quarter and a higher Q3 revenue yield per ASK of US$9.10 versus US$8.34 in Q3 FY 2024 suggest the airline was able to collect more revenue per unit of capacity in at least part of the year.
- at the same time, EPS across those quarters ranged from US$0.03 to US$0.68, which shows that even with healthy load factors, earnings per share can move around quite a bit from quarter to quarter.
High P/E and DCF fair value gap
- The shares trade on a trailing P/E of 22.1x at a price of US$21.84, compared with a DCF fair value of US$60.51 and an industry average P/E of 9.5x and peer average of 10x.
- Critics often focus on valuation, and here:
- the 22.1x P/E is more than double the 9.5x Global Airlines industry average and above the 10x peer average, which feeds a bearish view that the stock is priced more expensively than many airline names on trailing earnings.
- on the other hand, the DCF fair value of US$60.51 versus the current US$21.84 and the referenced earnings growth history and forecasts give supporters numbers they can point to when arguing that the current price sits well below that cash flow based estimate.
If you want to see how these figures tie into a fuller view of growth, profitability, and valuation, take a look at Curious how numbers become stories that shape markets? Explore Community Narratives to compare different narratives investors are building around Sun Country.
Next Steps
Don't just look at this quarter; the real story is in the long-term trend. We've done an in-depth analysis on Sun Country Airlines Holdings's growth and its valuation to see if today's price is a bargain. Add the company to your watchlist or portfolio now so you don't miss the next big move.
See What Else Is Out There
Sun Country’s slightly softer net margin, uneven quarterly EPS, and a P/E well above airline peers highlight that investors are paying a premium for mixed profitability.
If that mix of high pricing and choppy earnings gives you pause, check out 86 resilient stocks with low risk scores to focus on companies where returns and risk profiles look more balanced.
This article by Simply Wall St is general in nature. We provide commentary based on historical data and analyst forecasts only using an unbiased methodology and our articles are not intended to be financial advice. It does not constitute a recommendation to buy or sell any stock, and does not take account of your objectives, or your financial situation. We aim to bring you long-term focused analysis driven by fundamental data. Note that our analysis may not factor in the latest price-sensitive company announcements or qualitative material. Simply Wall St has no position in any stocks mentioned.
Have feedback on this article? Concerned about the content? Get in touch with us directly. Alternatively, email editorial-team@simplywallst.com