
- LIVE QUOTES
- LEARN
- HELP
 Nasdaq
 Wall Street Journal
EN
EastGroup Properties FFO Growth Reinforces Bullish Narratives Despite Premium 39.3x P E Multiple
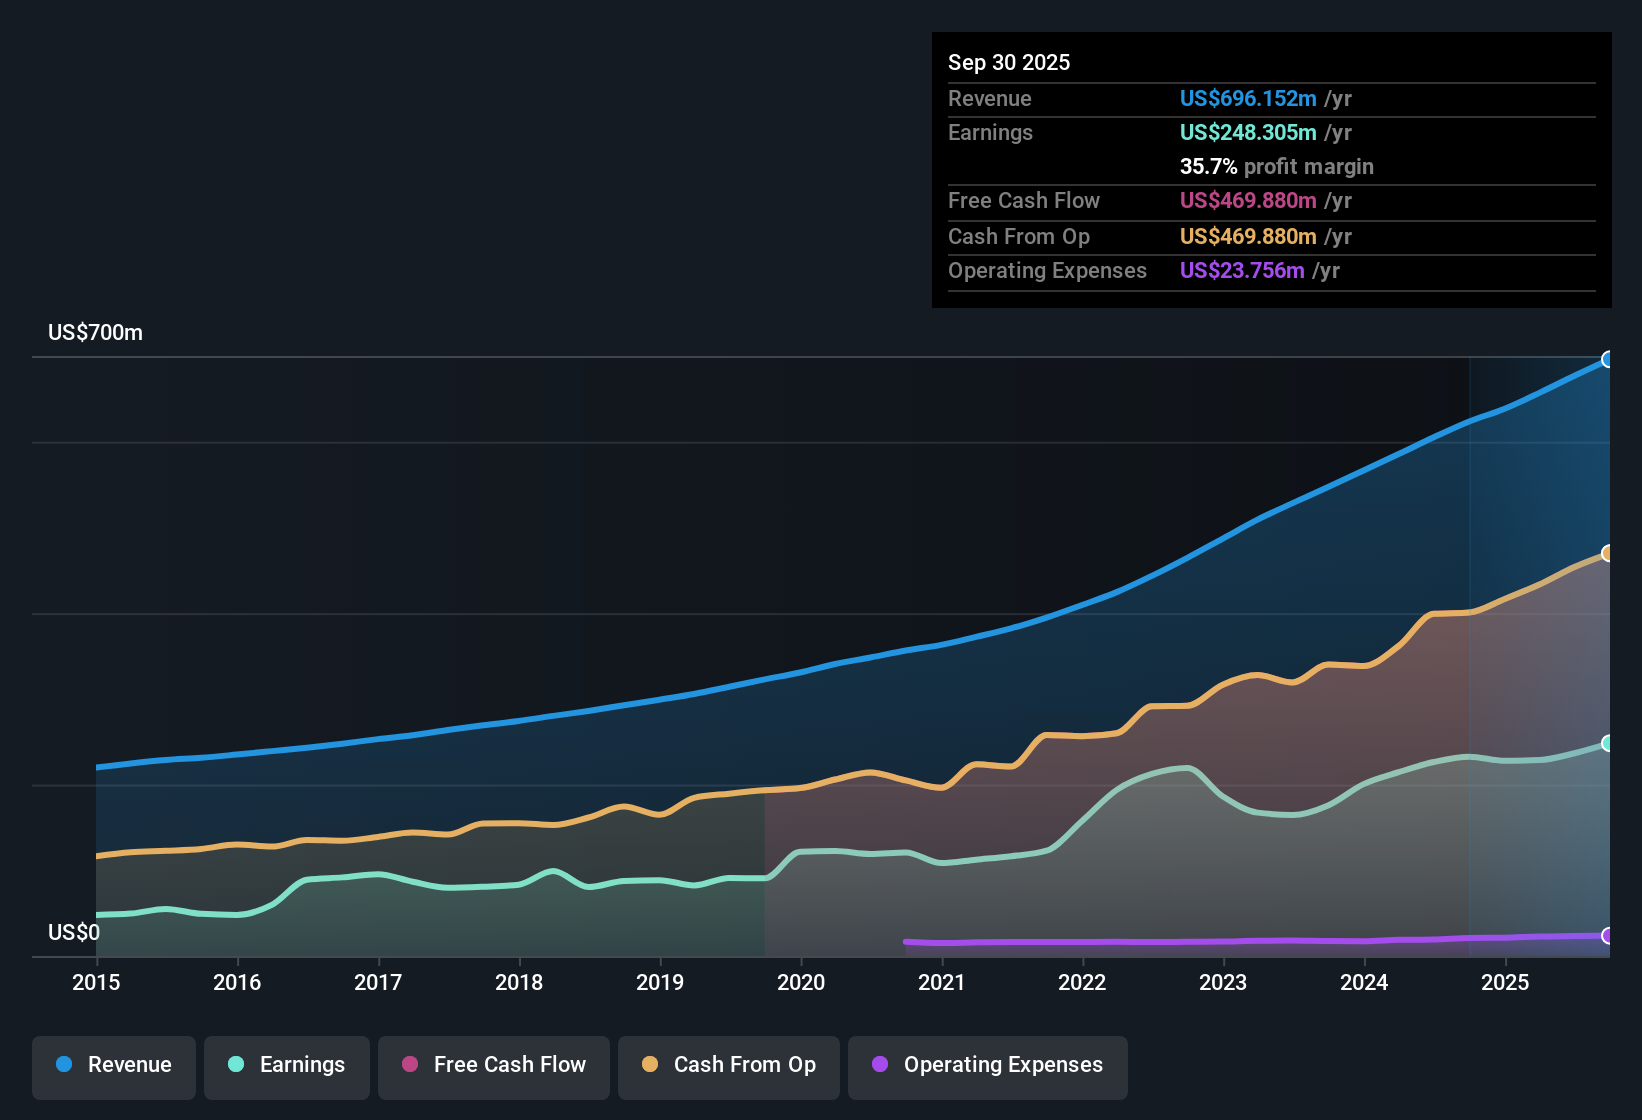
EastGroup Properties (EGP) has capped FY 2025 with fourth quarter total revenue of US$189.2 million and basic EPS of US$1.27, alongside funds from operations of US$124.8 million, giving investors a clean snapshot of how the industrial REIT is currently performing. The company has seen total revenue move from US$164.0 million in Q4 2024 to US$189.2 million in Q4 2025, while basic EPS shifted from US$1.17 to US$1.27 over the same period. This frames a year where the income statement and cash flow profile both stayed aligned with the broader earnings story. With a net profit margin sitting at 35.7%, these results set the stage for investors to focus on how sustainably those margins can be held.
See our full analysis for EastGroup Properties.With the headline numbers on the table, the next step is to see how this earnings print lines up with the widely followed narratives around growth, quality and risk for EastGroup, and where the latest data might challenge those views.
Curious how numbers become stories that shape markets? Explore Community Narratives
FFO And TTM Numbers Back The 35.7% Margin Story
- On a trailing twelve month basis, EastGroup generated US$474.3 million of FFO and US$721.3 million of total revenue, with net income of US$257.4 million, which lines up with the 35.7% net profit margin you are seeing in the latest quarterly snapshot.
- What stands out for the more bullish investors is that trailing earnings are up about 13% year over year and have grown around 13.9% per year over five years. They argue this is consistent with a margin profile that has held at 35.7%, yet
- those same figures also invite a basic question for you as a shareholder, which is whether growth around the 9.2% earnings forecast sits high enough to justify paying for that margin stability at current pricing.
- the link between FFO of US$474.3 million and net income of US$257.4 million highlights that a lot of the cash style performance is still flowing through, which bullish voices say supports the idea of “high quality” past earnings rather than one off spikes.
Premium 39.3x P/E, Yet DCF Fair Value Sits Higher
- The shares trade on a 39.3x P/E versus 18.4x for the Global Industrial REITs average and 31.2x for peers, while a DCF fair value of US$222.84 sits above the current US$189.91 share price.
- Bears focus on the high 39.3x P/E as a key risk, arguing that paying a premium multiple leaves little room for disappointment, yet
- the DCF fair value estimate that is about 14.8% above the market price, and the fact that trailing earnings are still growing around 13%, both push back on the idea that the valuation is purely optimism with no support from the cash flows.
- critics also point to the high debt level as something that could bite if financing costs rise, which matters far more when the multiple is well above the 18.4x industry average and 31.2x peer level.
3.26% Dividend Against A High Debt Load
- Income focused holders are collecting a 3.26% dividend yield, but the company is also flagged as having a high level of debt, which sits in the background of every discussion about future payouts.
- Supporters of the more cautious view highlight that the high debt load can limit flexibility even with a 35.7% net margin and 13% trailing earnings growth, because
- interest expenses can eat into the cash that ultimately backs that 3.26% yield, especially when the balance sheet already carries more leverage than some investors are comfortable with.
- the combination of a premium 39.3x P/E and meaningful debt means you are relying on both continued earnings growth around the 9.2% forecast and stable financing conditions to keep the income stream and valuation profile where they are today.
If you want to see how other investors are joining the dots between these numbers and the longer term story, have a look at 📊 Read the full EastGroup Properties Consensus Narrative.
Next Steps
Don't just look at this quarter; the real story is in the long-term trend. We've done an in-depth analysis on EastGroup Properties's growth and its valuation to see if today's price is a bargain. Add the company to your watchlist or portfolio now so you don't miss the next big move.
Explore Alternatives
EastGroup’s rich 39.3x P/E, high debt load and reliance on earnings forecasts leave little room if margins, cash flows or financing conditions weaken.
If that mix of premium pricing and leverage feels a bit tight for your comfort, check out solid balance sheet and fundamentals stocks screener (45 results) to focus on companies with sturdier financial footing.
This article by Simply Wall St is general in nature. We provide commentary based on historical data and analyst forecasts only using an unbiased methodology and our articles are not intended to be financial advice. It does not constitute a recommendation to buy or sell any stock, and does not take account of your objectives, or your financial situation. We aim to bring you long-term focused analysis driven by fundamental data. Note that our analysis may not factor in the latest price-sensitive company announcements or qualitative material. Simply Wall St has no position in any stocks mentioned.
Have feedback on this article? Concerned about the content? Get in touch with us directly. Alternatively, email editorial-team@simplywallst.com