
- LIVE QUOTES
- LEARN
- HELP
 Nasdaq
 Wall Street Journal
EN
Is It Too Late To Consider Carlisle Companies (CSL) After Its Sharp Share Price Run-Up?
- If you are wondering whether Carlisle Companies at around US$401 per share is still reasonably priced or starting to look stretched, you are not alone.
- The stock has moved sharply recently, with returns of 17.3% over the past week, 19.3% over the past month, 22.1% year to date, 16.1% over 1 year, 63.4% over 3 years, and 182.8% over 5 years.
- These moves have kept Carlisle on many investors' watchlists, as the share price action can influence how people think about both risk and opportunity. At the same time, the company continues to attract attention in broader market coverage, which helps keep liquidity and sentiment in focus for longer term holders.
- On our valuation checks, Carlisle Companies currently scores 3 out of 6. Next we will walk through what different valuation methods say about that score, before finishing with a more rounded way to think about whether the current price makes sense.
Approach 1: Carlisle Companies Discounted Cash Flow (DCF) Analysis
A Discounted Cash Flow, or DCF, model takes Carlisle Companies projected future cash flows and discounts them back to what they might reasonably be worth in today’s dollars. It is essentially asking what those future streams of cash are worth to you right now.
For Carlisle, the model used is a 2 Stage Free Cash Flow to Equity approach, based on its last twelve month free cash flow of about $968.9 million. Analysts provide free cash flow estimates out to 2028, with Simply Wall St extrapolating beyond that. Within this framework, projected free cash flow for 2035 is $1,213.7 million, and each future year is discounted back using the model’s assumptions to reflect the time value of money and risk.
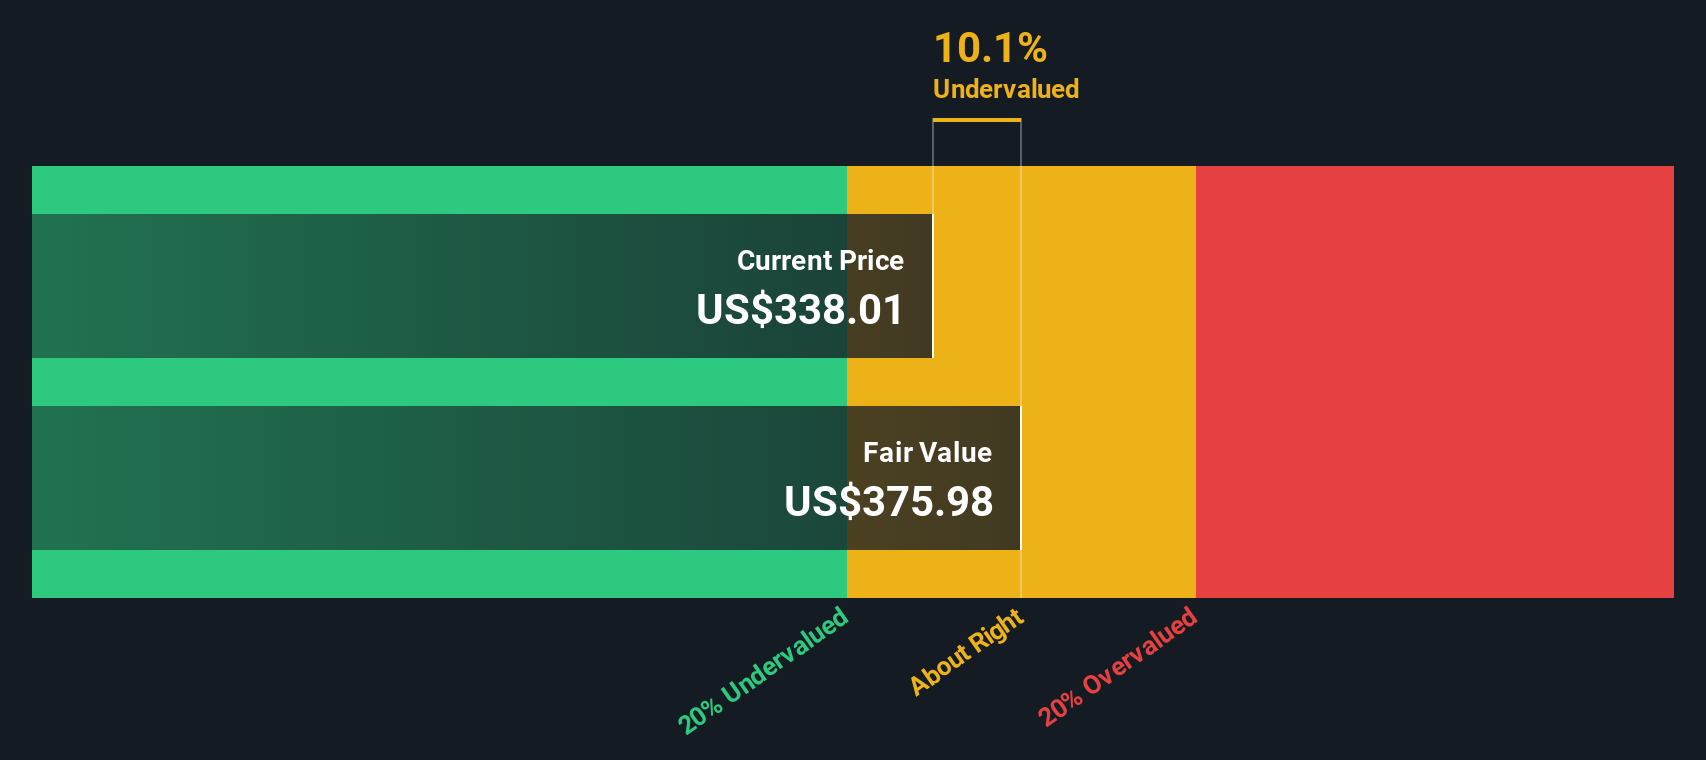
Putting all of these discounted cash flows together gives an estimated intrinsic value of about $398.82 per share. Against a current share price around $401, the DCF suggests the stock is roughly 0.5% overvalued, which is effectively in the same ballpark.
Result: ABOUT RIGHT
Carlisle Companies is fairly valued according to our Discounted Cash Flow (DCF), but this can change at a moment's notice. Track the value in your watchlist or portfolio and be alerted on when to act.
Approach 2: Carlisle Companies Price vs Earnings
For a profitable business like Carlisle Companies, the P/E ratio is a straightforward way to think about what you are paying for each dollar of earnings. Investors typically accept a higher P/E when they expect stronger growth or see lower risk, and look for a lower P/E when growth is more modest or risks feel higher.
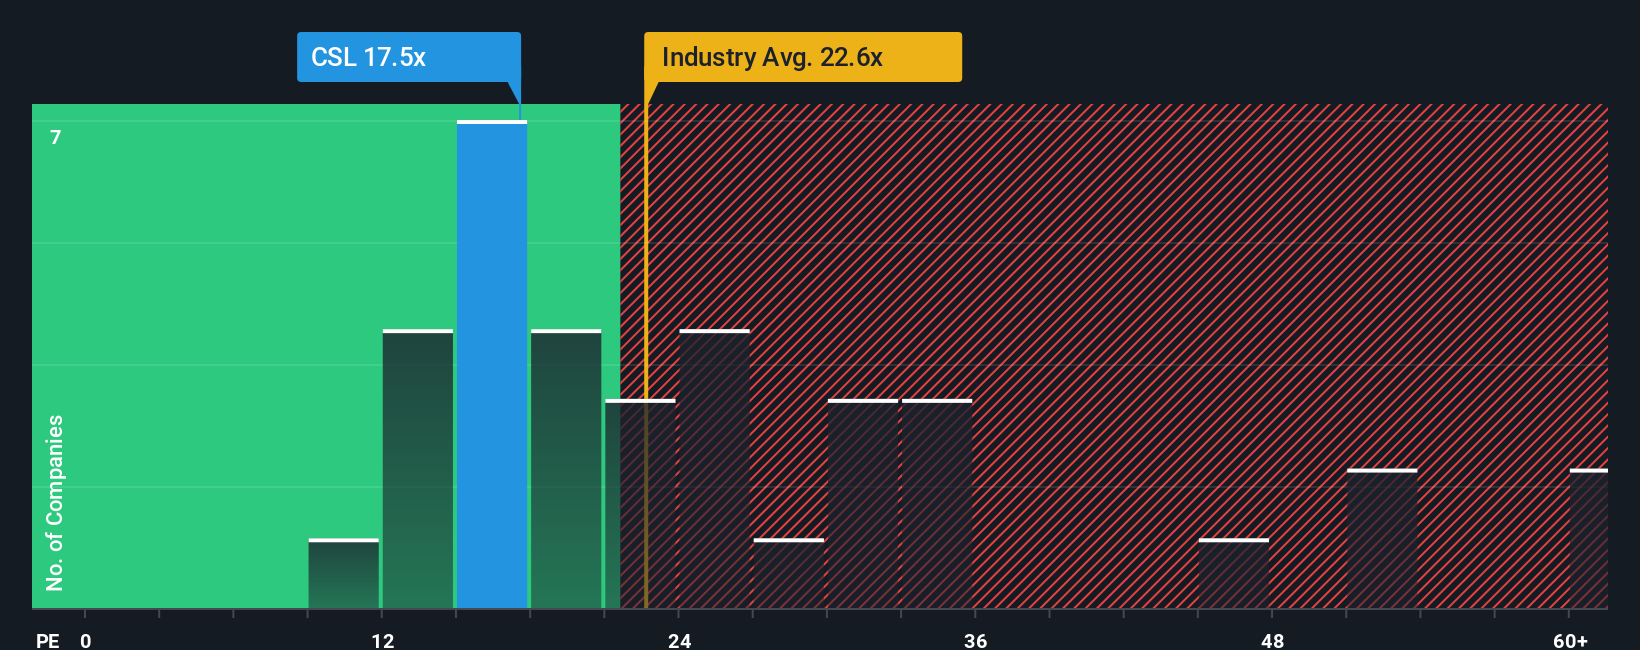
Carlisle currently trades on a P/E of 22.51x. That sits close to both the Building industry average P/E of 22.43x and the peer average of 23.17x, so the market is broadly lining it up with similar companies. Simply Wall St also calculates a proprietary “Fair Ratio” for Carlisle of 25.63x. This is the P/E that might be expected given its earnings growth profile, margins, industry, market value and risk characteristics.
This Fair Ratio aims to be more tailored than a simple comparison with peers or the sector, because it folds in company specific factors rather than relying only on broad group averages. With Carlisle’s current P/E of 22.51x sitting below the Fair Ratio of 25.63x, this approach points to the shares trading at a discount to what the model suggests could be reasonable.
Result: UNDERVALUED
P/E ratios tell one story, but what if the real opportunity lies elsewhere? Start investing in legacies, not executives. Discover our 22 top founder-led companies.
Upgrade Your Decision Making: Choose your Carlisle Companies Narrative
Earlier we mentioned that there is an even better way to understand valuation, so let us introduce you to Narratives, which are simply your story about a company expressed through the numbers you think are reasonable for fair value, future revenue, earnings and margins.
A Narrative connects what you believe about Carlisle Companies to a forecast and then to a fair value, so instead of staring at ratios in isolation, you are tying your view of the business directly to a set of financial expectations.
On Simply Wall St’s Community page, which is used by millions of investors, Narratives are set up as easy templates where you can adjust assumptions and instantly see how your fair value compares with the current share price. This can help you decide whether you see more upside or risk at today’s level.
Because Narratives on the platform automatically refresh when new information such as news or earnings is added, your Carlisle view can stay current without you rebuilding a model each time. You can also see how one investor’s high fair value can sit well above another investor’s lower fair value, even when both are looking at the same company.
Do you think there's more to the story for Carlisle Companies? Head over to our Community to see what others are saying!

This article by Simply Wall St is general in nature. We provide commentary based on historical data and analyst forecasts only using an unbiased methodology and our articles are not intended to be financial advice. It does not constitute a recommendation to buy or sell any stock, and does not take account of your objectives, or your financial situation. We aim to bring you long-term focused analysis driven by fundamental data. Note that our analysis may not factor in the latest price-sensitive company announcements or qualitative material. Simply Wall St has no position in any stocks mentioned.
Have feedback on this article? Concerned about the content? Get in touch with us directly. Alternatively, email editorial-team@simplywallst.com