
- LIVE QUOTES
- LEARN
- HELP
 Nasdaq
 Wall Street Journal
EN
Is Tyler Technologies (TYL) Now Offering Value After Steep Share Price Pullback
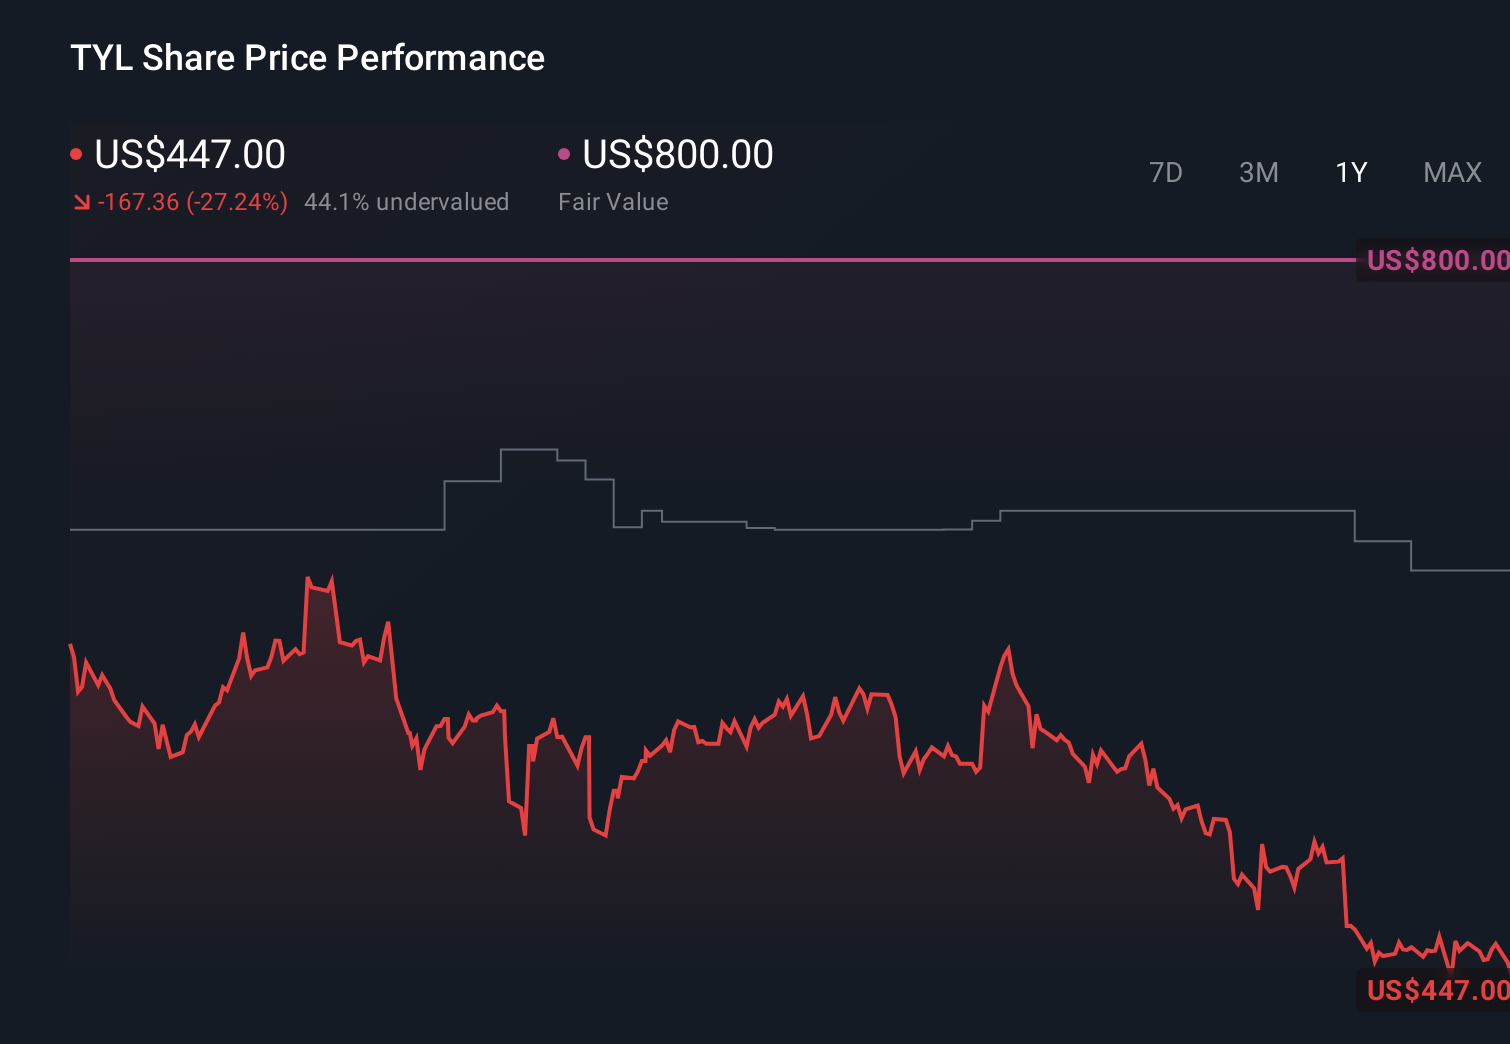
With Tyler Technologies on many investors' watchlists, you might be wondering whether the current share price reflects a fair value or if the recent pullback is creating a potential opportunity or fresh risk.
Over the last week the stock has recorded a 18.1% decline, with a 22.2% decline over 30 days and a 21.2% decline year to date. The 1-year return stands at a 44.3% decline and the 3-year and 5-year returns are 5.3% and a 23.8% decline respectively.
This swing in returns has coincided with ongoing investor attention on Tyler Technologies' place in the US software sector and how its long term growth story lines up against its current valuation. While day-to-day headlines can push the share price around in the short term, many investors are trying to separate temporary sentiment shifts from changes in the long term outlook.
Currently, Tyler Technologies records a valuation score of 3 out of 6, reflecting the number of checks where the stock screens as undervalued. Next, we will look at what different valuation methods suggest about the current price before finishing with a way to tie all those methods together into one clearer view of value.
Find out why Tyler Technologies's -44.3% return over the last year is lagging behind its peers.
Approach 1: Tyler Technologies Discounted Cash Flow (DCF) Analysis
A DCF model takes expected future cash flows, discounts them back to today using a required rate of return, then adds them up to estimate what the whole business could be worth right now.
For Tyler Technologies, the model used is a 2 Stage Free Cash Flow to Equity approach based on cash flow projections. The latest twelve month Free Cash Flow is about $584.8 million, and analysts and internal estimates project Free Cash Flow reaching about $1.1 billion by 2030. Simply Wall St notes that analysts typically provide forecasts for up to 5 years, with later years extrapolated from those assumptions.
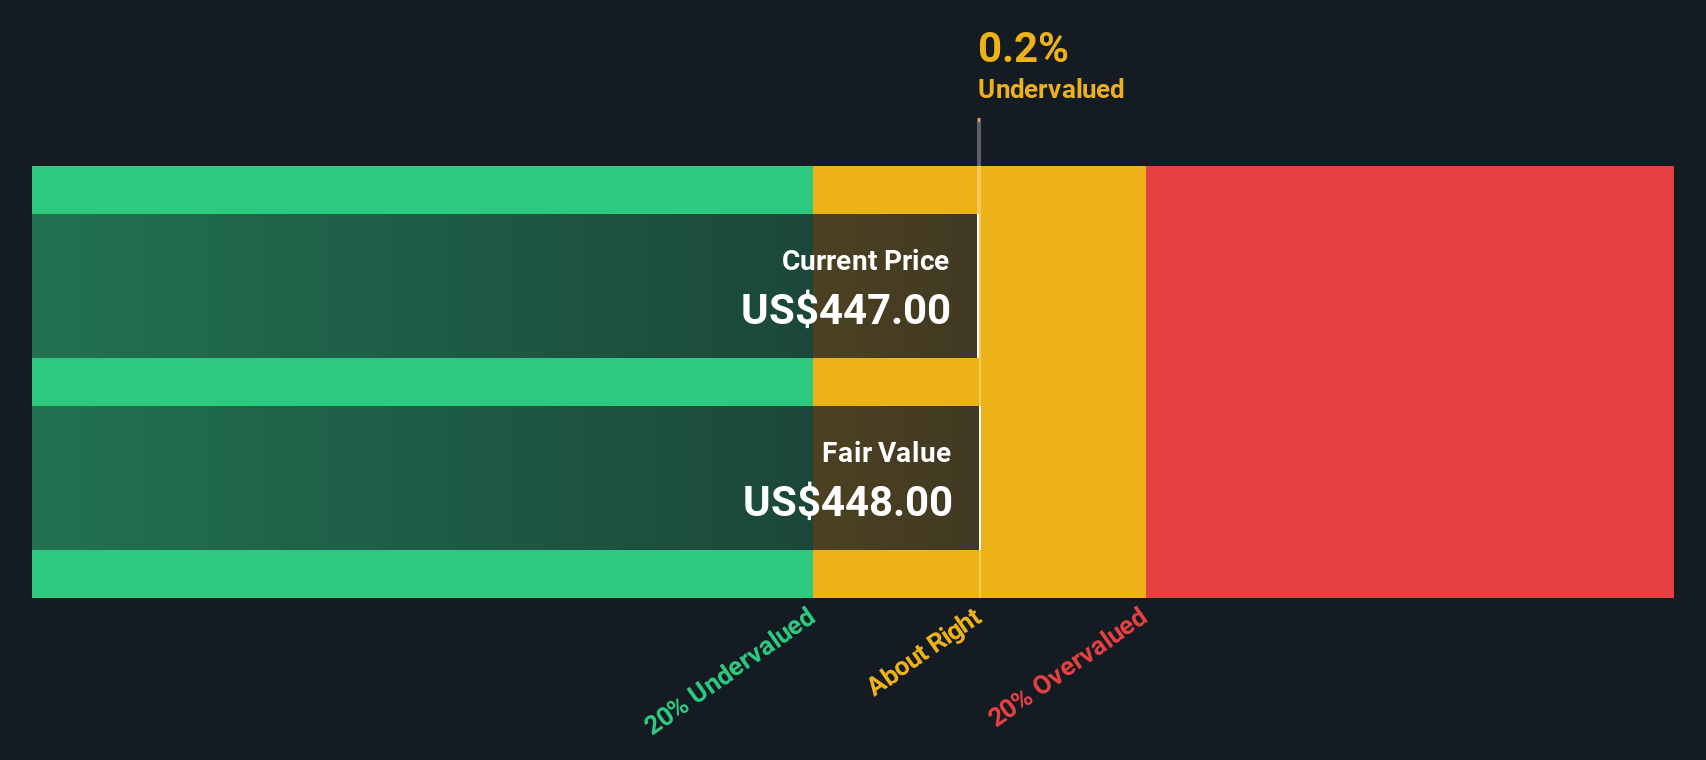
On this basis, the DCF model arrives at an estimated intrinsic value of about $430.30 per share. That implies the shares trade at a 20.2% discount to this estimate, suggesting the price is below what the cash flow model indicates could be a fair value.
Result: UNDERVALUED
Our Discounted Cash Flow (DCF) analysis suggests Tyler Technologies is undervalued by 20.2%. Track this in your watchlist or portfolio, or discover 863 more undervalued stocks based on cash flows.
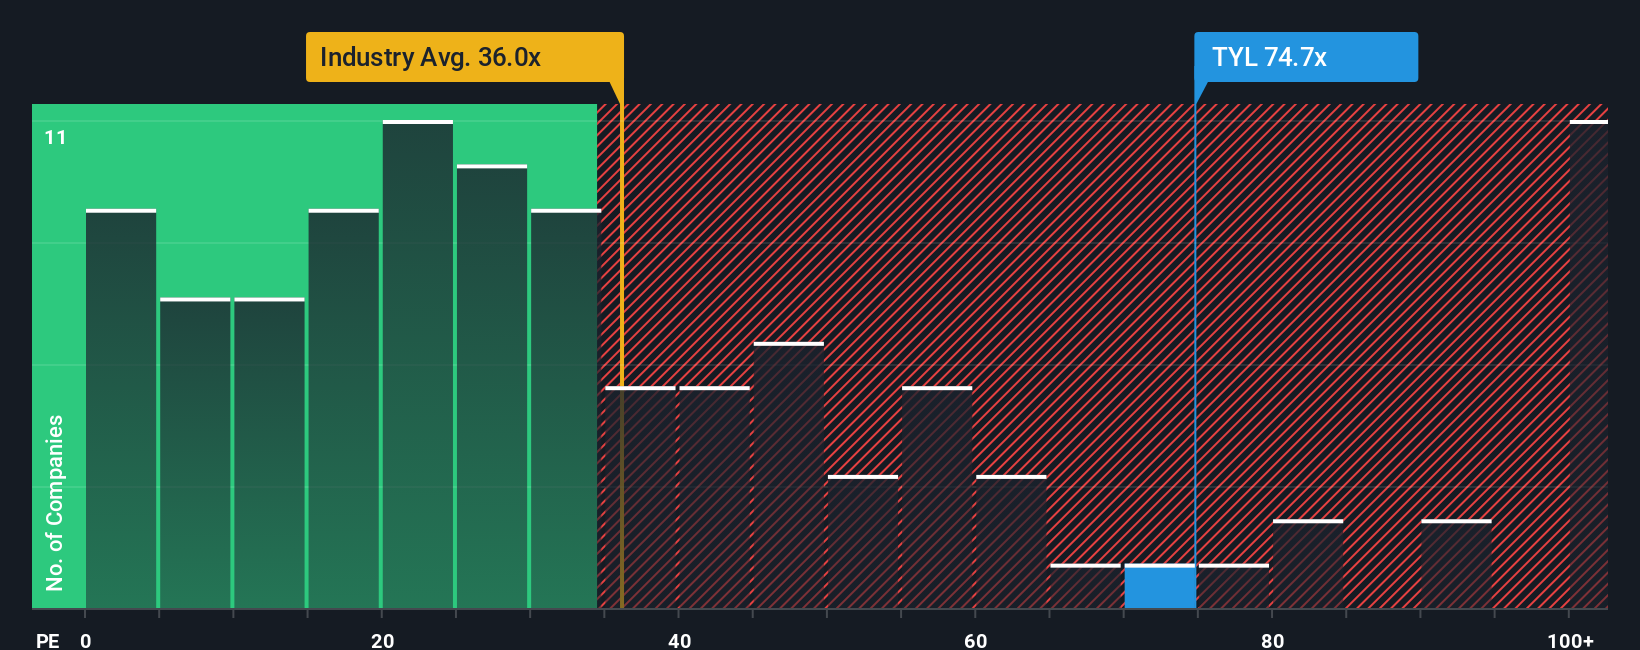
Approach 2: Tyler Technologies Price vs Earnings (P/E)
For a profitable business like Tyler Technologies, the P/E ratio is a straightforward way to relate what you pay for each share to the earnings the company is currently generating. Investors usually expect a higher P/E when they see stronger growth potential or lower perceived risk, and a lower P/E when growth expectations or perceived risk are more modest.
Tyler Technologies currently trades on a P/E of 46.84x, compared with the Software industry average of 26.25x and a peer group average of 30.72x. Simply Wall St also calculates a proprietary “Fair Ratio” of 28.71x, which is an estimate of what Tyler Technologies’ P/E might be given factors such as its earnings growth profile, profit margins, industry, market capitalization and specific risks.
This Fair Ratio is intended to be more tailored than a simple comparison to peers or an industry average because it adjusts for company specific characteristics rather than assuming all software companies warrant similar P/E levels. When compared to this Fair Ratio, Tyler Technologies’ current P/E of 46.84x is higher, which points to the shares trading at a richer multiple than the model suggests.
Result: OVERVALUED
P/E ratios tell one story, but what if the real opportunity lies elsewhere? Discover 1432 companies where insiders are betting big on explosive growth.
Upgrade Your Decision Making: Choose your Tyler Technologies Narrative
Earlier we mentioned that there is an even better way to understand valuation, so let us introduce you to Narratives, which let you write a clear story about Tyler Technologies by linking your view of its future revenue, earnings and margins to a forecast and then to your own estimate of fair value.
On Simply Wall St’s Community page, used by millions of investors, Narratives give you a simple framework to say what you think the business can achieve. You can plug that into a financial forecast that updates when new information like news or earnings arrives, and then compare your Fair Value to today’s share price to help you decide whether the stock looks attractive, fully priced or expensive for your goals.
For example, one Tyler Technologies Narrative on the Community page might assume a higher future margin and arrive at a Fair Value well above the current price. Another might use more modest revenue expectations and produce a Fair Value below where the stock trades today, illustrating how different investors can look at the same company and come to very different conclusions.
Do you think there's more to the story for Tyler Technologies? Head over to our Community to see what others are saying!
This article by Simply Wall St is general in nature. We provide commentary based on historical data and analyst forecasts only using an unbiased methodology and our articles are not intended to be financial advice. It does not constitute a recommendation to buy or sell any stock, and does not take account of your objectives, or your financial situation. We aim to bring you long-term focused analysis driven by fundamental data. Note that our analysis may not factor in the latest price-sensitive company announcements or qualitative material. Simply Wall St has no position in any stocks mentioned.
Have feedback on this article? Concerned about the content? Get in touch with us directly. Alternatively, email editorial-team@simplywallst.com