
- LIVE QUOTES
- LEARN
- HELP
 Nasdaq
 Wall Street Journal
EN
Is It Too Late To Consider Lennar (LEN) After Recent Share Price Strength?
- If you are wondering whether Lennar at around US$115 offers good value right now, or if most of the upside is already priced in, this article walks through the key numbers so you can judge for yourself.
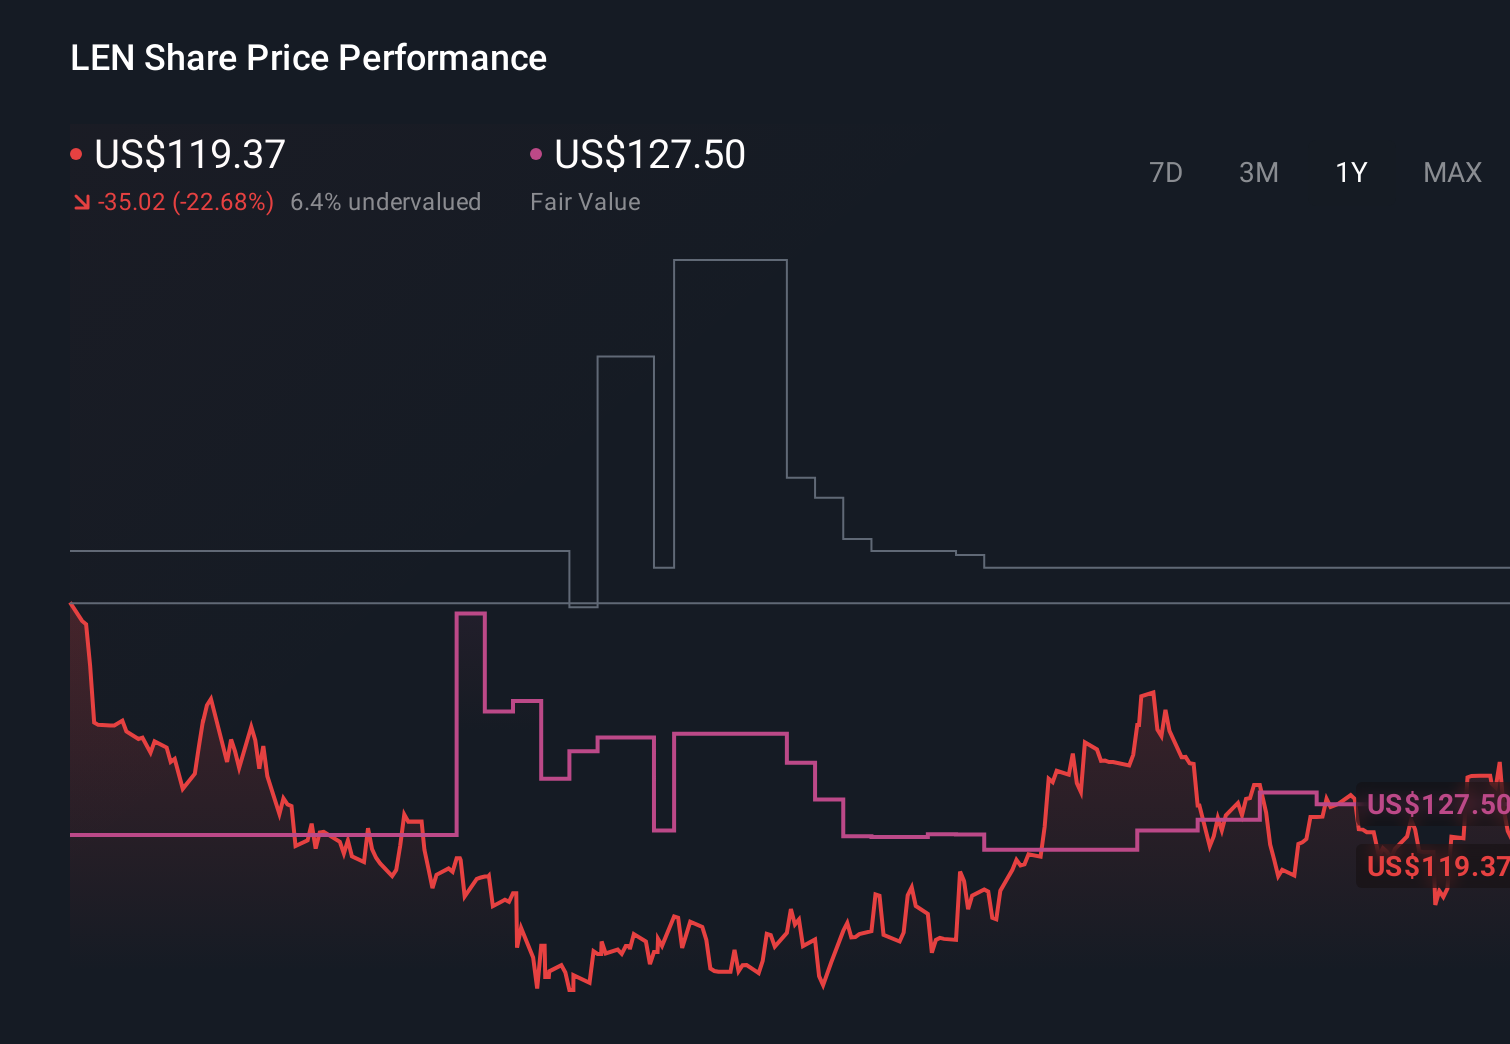
- The stock has returned 4.0% over the last 7 days, 9.4% over the past 30 days and 10.6% year to date, while the 1 year return sits at an 8.0% decline and the 3 and 5 year returns are 29.3% and 43.3% respectively.
- Recent attention on Lennar has focused on how US housing trends and sentiment toward homebuilders feed into investor expectations for the sector. These themes help frame why the share price has been moving and why valuation is back in focus.
- Lennar currently scores 1 out of 6 on our valuation checks. Next we will look at what different valuation approaches are saying about the stock, and then finish with a way to think about value that goes beyond the usual multiples and models.
Lennar scores just 1/6 on our valuation checks. See what other red flags we found in the full valuation breakdown.
Approach 1: Lennar Discounted Cash Flow (DCF) Analysis
A Discounted Cash Flow, or DCF, model estimates what a company could be worth by projecting its future cash flows and then discounting them back to today to reflect time and risk.
For Lennar, the model uses a 2 Stage Free Cash Flow to Equity approach, starting from last twelve months free cash flow of about US$65.4 million. Analysts provide explicit forecasts up to 2027, with free cash flow for that year at US$1.48b, and Simply Wall St extends those projections out to 2035 using its own assumptions.
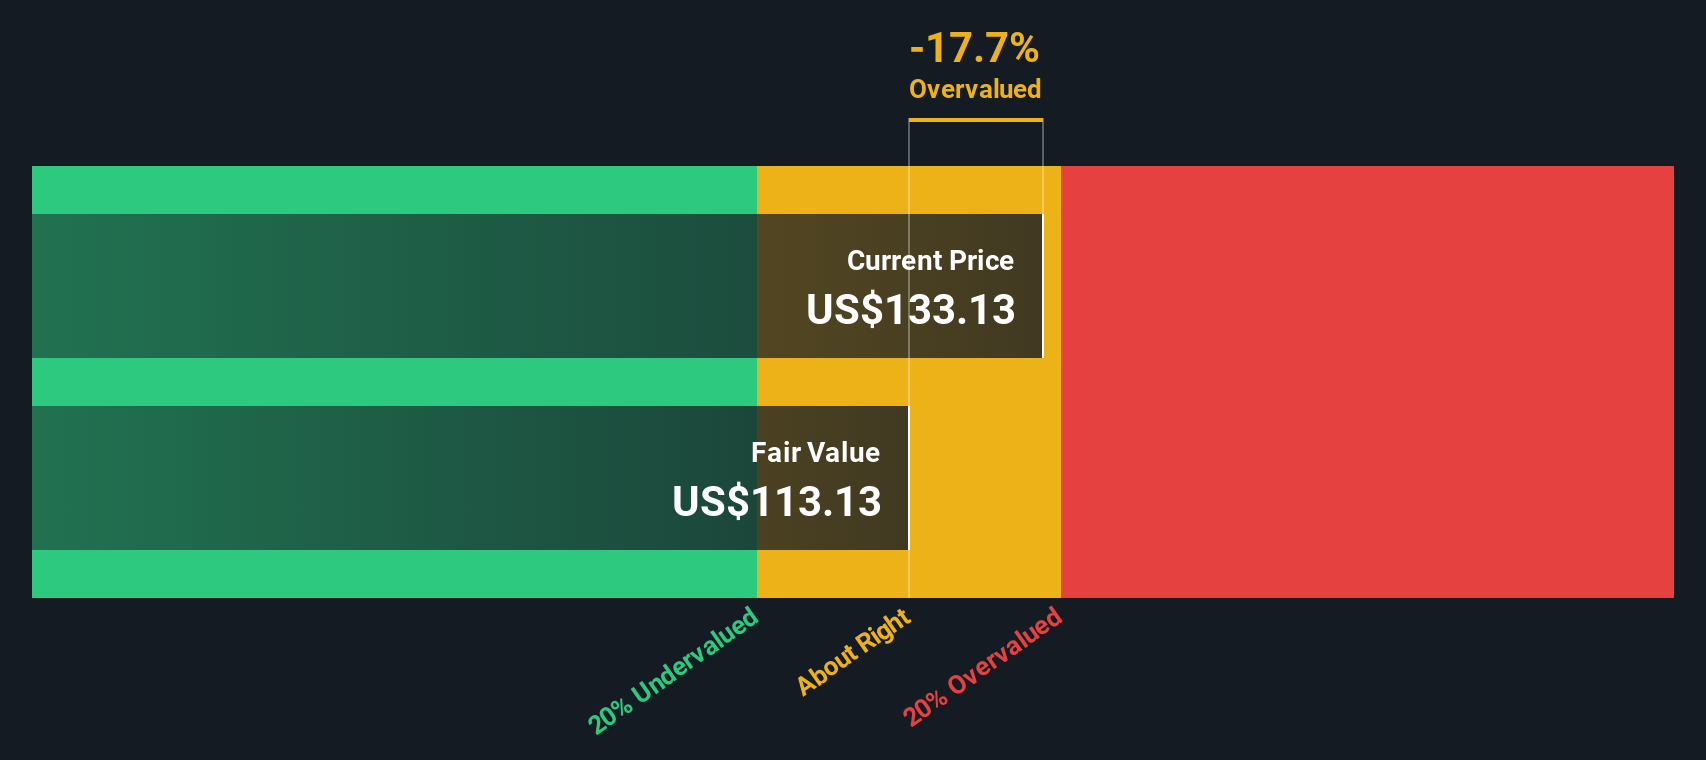
All those future cash flows, expressed in US$, are discounted back to today to get an estimated intrinsic value of US$89.77 per share. Compared with a share price around US$115, the DCF output implies the stock trades at roughly a 28.4% premium to this intrinsic value. On this model Lennar screens as expensive rather than cheap.
Result: OVERVALUED
Our Discounted Cash Flow (DCF) analysis suggests Lennar may be overvalued by 28.4%. Discover 865 undervalued stocks or create your own screener to find better value opportunities.
Approach 2: Lennar Price vs Earnings
For a profitable company like Lennar, the P/E ratio is a straightforward way to relate what you pay for each share to the earnings the business is currently generating. It lets you compare how the market is pricing one stream of earnings against another across similar companies.
What counts as a “normal” P/E depends largely on how much growth investors expect from those earnings and how risky they feel the business is. Higher expected growth or lower perceived risk can support a higher P/E, while slower growth or higher uncertainty usually goes with a lower P/E.
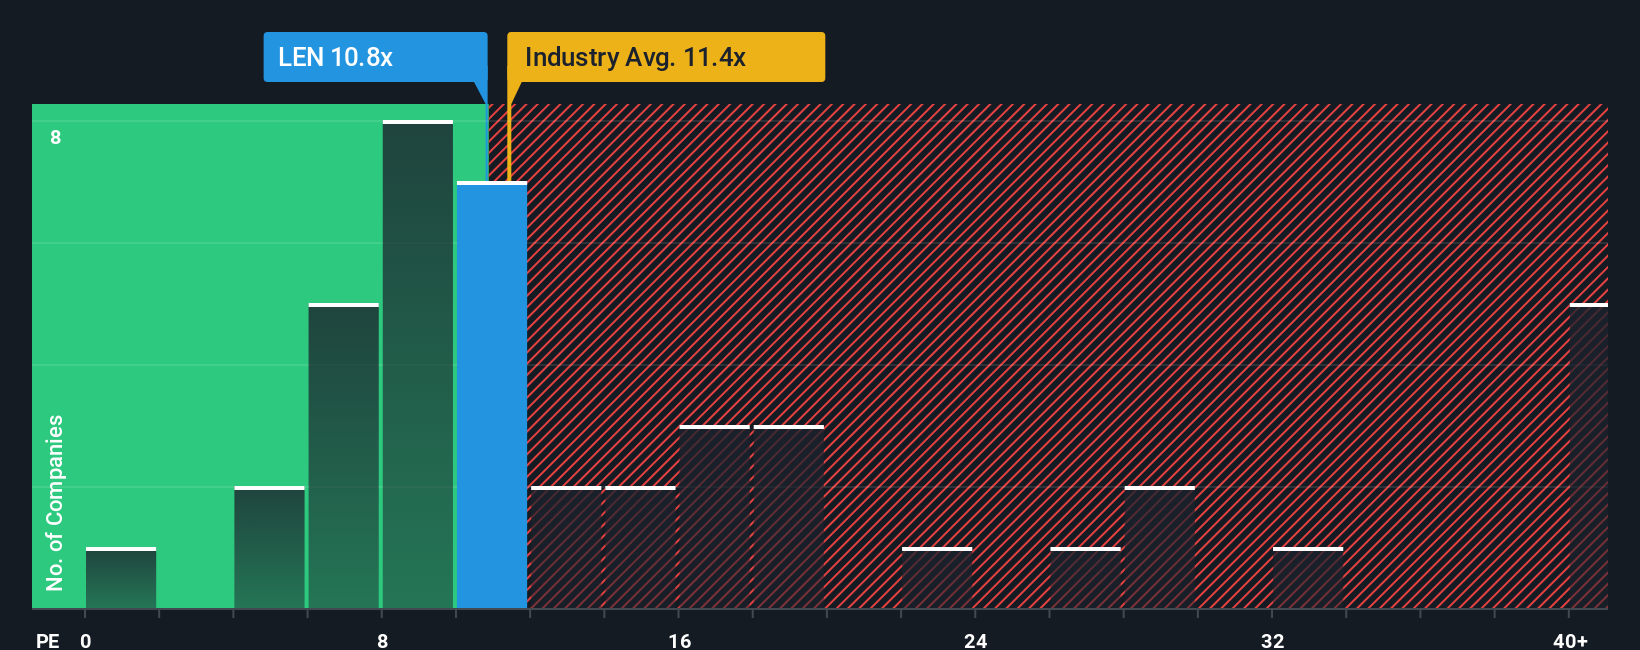
Lennar currently trades on a P/E of 13.83x. That sits above the Consumer Durables industry average of 12.71x and slightly above the peer average of 13.24x. Simply Wall St’s Fair Ratio for Lennar is 17.69x. This is its proprietary view of what a reasonable P/E might be, given factors such as earnings growth profile, industry, profit margin, market cap and specific risks.
Because the Fair Ratio folds all those inputs into one figure, it can be more tailored than a simple comparison with peers or the industry. With Lennar’s current P/E of 13.83x sitting below the Fair Ratio of 17.69x, the shares screen as undervalued on this metric.
Result: UNDERVALUED
P/E ratios tell one story, but what if the real opportunity lies elsewhere? Discover 1433 companies where insiders are betting big on explosive growth.
Upgrade Your Decision Making: Choose your Lennar Narrative
Earlier we mentioned that there is an even better way to think about value than any single model, so let us bring in Narratives, which are simply your own story about Lennar, tied directly to your view of its future revenue, earnings, margins and what you see as a fair value.
A Narrative links three things in a straight line: the business story you believe, the financial forecast that story implies, and the fair value you calculate from that forecast.
On Simply Wall St, Narratives sit inside the Community page. This allows you to quickly plug in your assumptions, see a fair value number, and then compare that to Lennar’s current share price to help you decide whether it looks attractive, fully priced or expensive for you.
Narratives update automatically when fresh information comes through, such as earnings releases or major news. This means your fair value view can keep pace without you rebuilding a model from scratch.
For example, one Lennar Narrative might assume conservative revenue growth and margins and arrive at a fair value well below today’s price. Another might assume stronger demand and more resilient margins and land on a higher fair value that sits closer to or above the current market price.
Do you think there's more to the story for Lennar? Head over to our Community to see what others are saying!
This article by Simply Wall St is general in nature. We provide commentary based on historical data and analyst forecasts only using an unbiased methodology and our articles are not intended to be financial advice. It does not constitute a recommendation to buy or sell any stock, and does not take account of your objectives, or your financial situation. We aim to bring you long-term focused analysis driven by fundamental data. Note that our analysis may not factor in the latest price-sensitive company announcements or qualitative material. Simply Wall St has no position in any stocks mentioned.
Have feedback on this article? Concerned about the content? Get in touch with us directly. Alternatively, email editorial-team@simplywallst.com