
- LIVE QUOTES
- LEARN
- HELP
 Nasdaq
 Wall Street Journal
EN
Eaton (ETN) Margin Dip To 14.9% Gently Tests Long Term Bullish Narratives
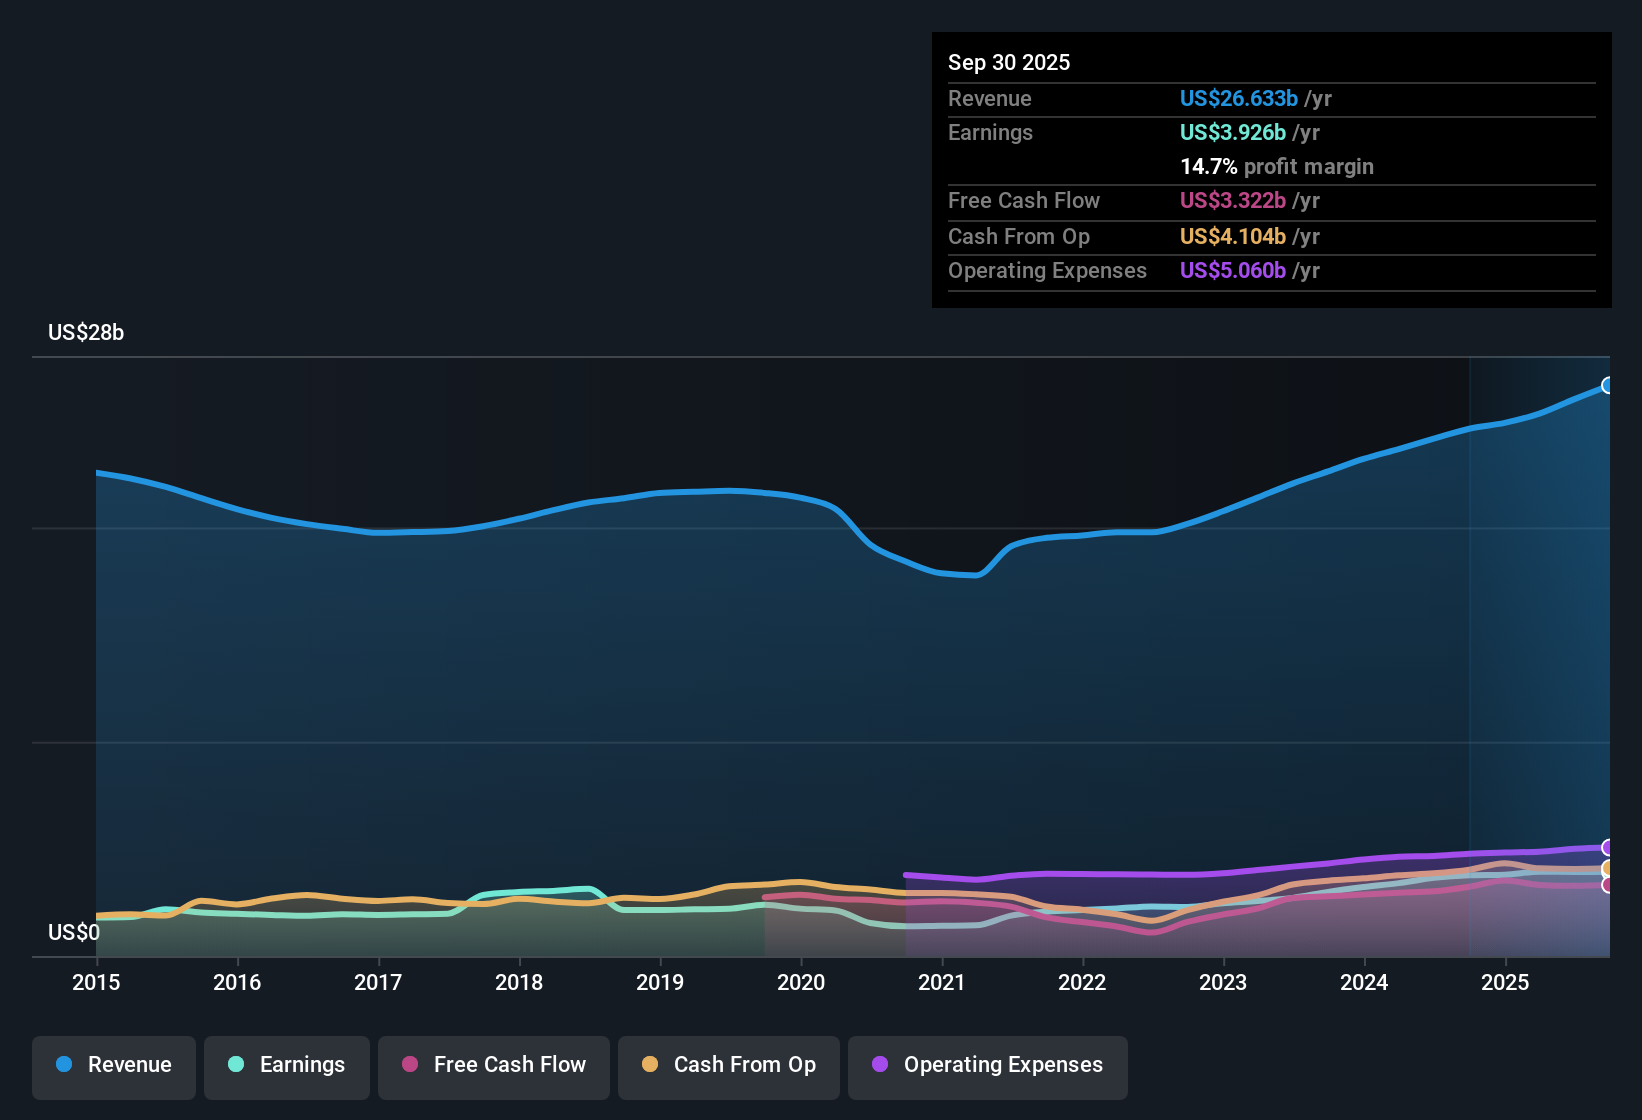
Eaton (ETN) has wrapped up FY 2025 with fourth quarter revenue of US$7.1b and basic EPS of US$2.92 on net income of US$1.1b, giving investors a clear set of headline numbers to work with as they assess the latest results. Over recent quarters, revenue has moved from US$6.2b in Q4 2024 to a range between US$6.4b and US$7.1b through 2025, while quarterly EPS has sat between US$2.46 and US$2.92, framed by a trailing twelve month EPS of US$10.48 and net income of US$4.1b that link directly to the current earnings print. With a trailing net margin of 14.9% sitting just below last year’s 15.3%, the focus now turns to how investors weigh that slight margin pressure against the earnings profile that underpins the latest quarter.
See our full analysis for Eaton.With the numbers on the table, the next step is to set these results against the most widely held narratives around Eaton’s growth, risks, and profitability to see which views hold up and which might need a rethink.
Curious how numbers become stories that shape markets? Explore Community Narratives
Multi year earnings growth context
- Over the last five years, earnings have grown at about 19.4% per year, while trailing twelve month net income sits at US$4.1b on US$27.4b of revenue, which lines up with the 14.9% net margin mentioned earlier.
- What supports a more bullish angle is that this five year earnings growth rate of 19.4% and the trailing EPS of US$10.48 both back up the idea of Eaton as a steadily growing industrial. At the same time, the slight margin slip from 15.3% to 14.9% shows that even with strong growth there are cost or mix pressures that bullish investors need to keep an eye on.
- Supporters can point to the combination of US$4.1b of trailing net income and a 19.4% annual earnings growth rate as evidence that profits have scaled meaningfully over time.
- At the same time, critics of the bullish view can reasonably highlight that the 0.4 percentage point margin change is a reminder that profitability is not moving in a straight line even when EPS is higher than in prior individual quarters like Q4 2024 at US$2.46.
Solid multi year growth with only a small margin dip is exactly the kind of pattern that long term bulls point to when they argue Eaton can keep compounding value over time, but the numbers still leave room for debate on how durable those margins really are. 📊 Read the full Eaton Consensus Narrative.
Valuation vs growth and DCF
- The shares trade on a P/E of 34.7x against trailing EPS of US$10.48 and a share price of US$365, while a stated DCF fair value of US$224.17 sits well below that price and the stock is also set against an earnings growth assumption of about 12.5% per year.
- What stands out for investors weighing a more cautious or bearish angle is the tension between paying 34.7x earnings at US$365 per share and a DCF fair value of US$224.17. At the same time, the same data describes past earnings as high quality and points to continued earnings growth of roughly 12.5% a year, which together give both sides of the debate something concrete to point to.
- Bears often focus on valuation, and the gap between the current price of US$365 and the DCF fair value of US$224.17 supports the concern that the stock price embeds more optimism than the cash flow model implies.
- On the other hand, those pushing back on the bearish view can highlight that the P/E of 34.7x matches the US electrical industry average and is below the 49.3x peer average, so relative multiples do not flag the same degree of stretch suggested by the DCF comparison.
Revenue pace and margin resilience
- Trailing revenue growth is described at about 8.3% per year compared with a 10.3% US market benchmark, and over the same trailing period Eaton converted US$27.4b of revenue into US$4.1b of net income at a 14.9% margin, slightly below the previous 15.3% level.
- What may surprise investors who expect either a very bullish or very bearish story is that this 8.3% revenue growth pace sits modestly below the 10.3% market benchmark while the margin shift from 15.3% to 14.9% is relatively small. This means the numbers neither strongly reinforce a high growth narrative nor fully back a margin compression worry.
- Supporters of a more upbeat view can argue that holding a margin close to 15% on US$27.4b of trailing revenue shows the business is still earning solid economics even when growth trails a broad market benchmark.
- Investors leaning to the cautious side can point to the combination of slightly slower revenue growth and a modestly lower margin plus the reference to a high level of debt as reasons to be careful about assuming these profitability levels automatically persist.
Next Steps
Don't just look at this quarter; the real story is in the long-term trend. We've done an in-depth analysis on Eaton's growth and its valuation to see if today's price is a bargain. Add the company to your watchlist or portfolio now so you don't miss the next big move.
See What Else Is Out There
Eaton’s slightly softer revenue pace versus the broader market, a modest margin slip, valuation tension against DCF, and references to higher debt leave some investors wanting a cleaner financial profile.
If that mix of slower revenue, pressured margins, and balance sheet concerns feels uncomfortable, use our solid balance sheet and fundamentals stocks screener (388 results) today to focus on companies with healthier finances and more straightforward earnings power.
This article by Simply Wall St is general in nature. We provide commentary based on historical data and analyst forecasts only using an unbiased methodology and our articles are not intended to be financial advice. It does not constitute a recommendation to buy or sell any stock, and does not take account of your objectives, or your financial situation. We aim to bring you long-term focused analysis driven by fundamental data. Note that our analysis may not factor in the latest price-sensitive company announcements or qualitative material. Simply Wall St has no position in any stocks mentioned.
Have feedback on this article? Concerned about the content? Get in touch with us directly. Alternatively, email editorial-team@simplywallst.com