
- LIVE QUOTES
- LEARN
- HELP
 Nasdaq
 Wall Street Journal
EN
Is Daqo New Energy (DQ) Pricing Reflect Its Volatile Share Performance And Solar Sector Sentiment
- If you are wondering whether Daqo New Energy is priced attractively or not, you are not alone. The stock has been drawing attention from investors trying to work out if the current share price reflects its fundamentals.
- The recent share price tells a mixed story, with a 14.1% decline over the last 7 days and a 21.2% decline over the last 30 days, but a 24.0% gain over the past year alongside a 46.3% decline over 3 years and an 81.2% decline over 5 years.
- Recent news around Daqo New Energy has focused on its position in the solar materials space and shifting sentiment toward the sector. This has given investors more data points to weigh against the share price moves. These updates have added context for both short term traders reacting to volatility and longer term holders reassessing what they are willing to pay for the stock.
- Daqo New Energy currently holds a valuation score of 4 out of 6, suggesting several checks indicate the shares may be undervalued. Next, we will walk through the key valuation methods behind that number and then finish with a framework that can help you think about value in a more complete way.
Find out why Daqo New Energy's 24.0% return over the last year is lagging behind its peers.
Approach 1: Daqo New Energy Discounted Cash Flow (DCF) Analysis
A Discounted Cash Flow, or DCF, model estimates what a business might be worth today by projecting its future cash flows and discounting them back to a present value.
For Daqo New Energy, the model used is a 2 Stage Free Cash Flow to Equity approach. The latest twelve month free cash flow (FCF) is a loss of $511.07 million. Analysts provide explicit forecasts out to 2027, with FCF of $104.63 million in that year. Simply Wall St then extrapolates those estimates further. By 2035, the extrapolated FCF projection is $1,225.47 million.
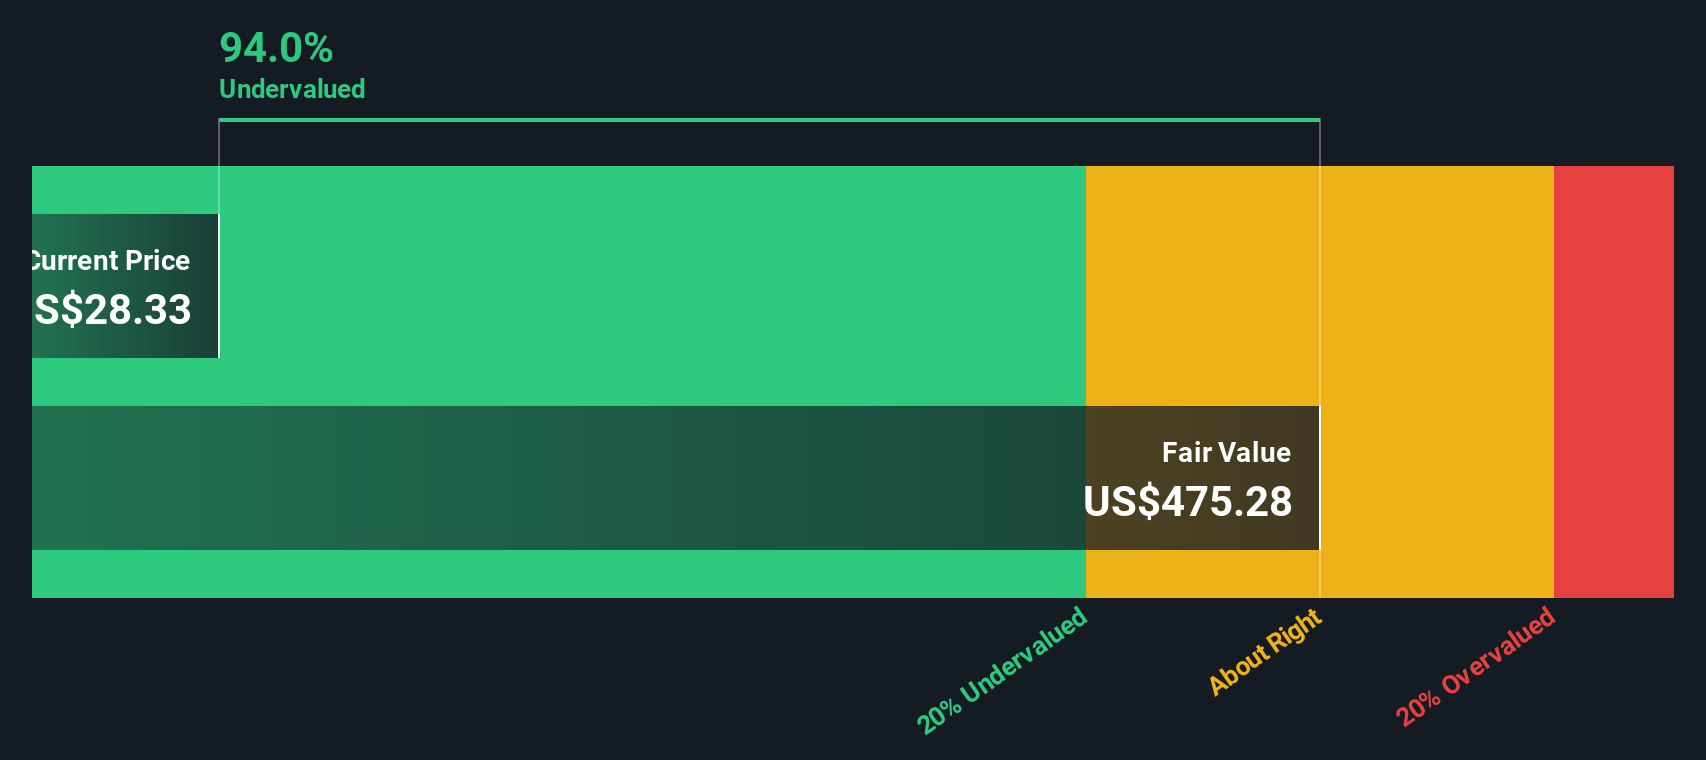
Bringing all those projected cash flows back to today gives an estimated intrinsic value of $117.54 per share. Compared with the current share price, the model suggests an intrinsic discount of 80.1%, which indicates that the shares screen as materially undervalued on this DCF view alone.
Result: UNDERVALUED
Our Discounted Cash Flow (DCF) analysis suggests Daqo New Energy is undervalued by 80.1%. Track this in your watchlist or portfolio, or discover 871 more undervalued stocks based on cash flows.
Approach 2: Daqo New Energy Price vs Sales
For companies where earnings can be uneven, the P/S ratio is a useful way to think about value because it focuses on how much investors are paying for each dollar of revenue rather than profit, which can swing with input costs and one off items.
What counts as a reasonable P/S depends a lot on growth expectations and risk. Higher growth and lower perceived risk can justify a higher multiple, while slower growth or higher risk tends to support a lower one.
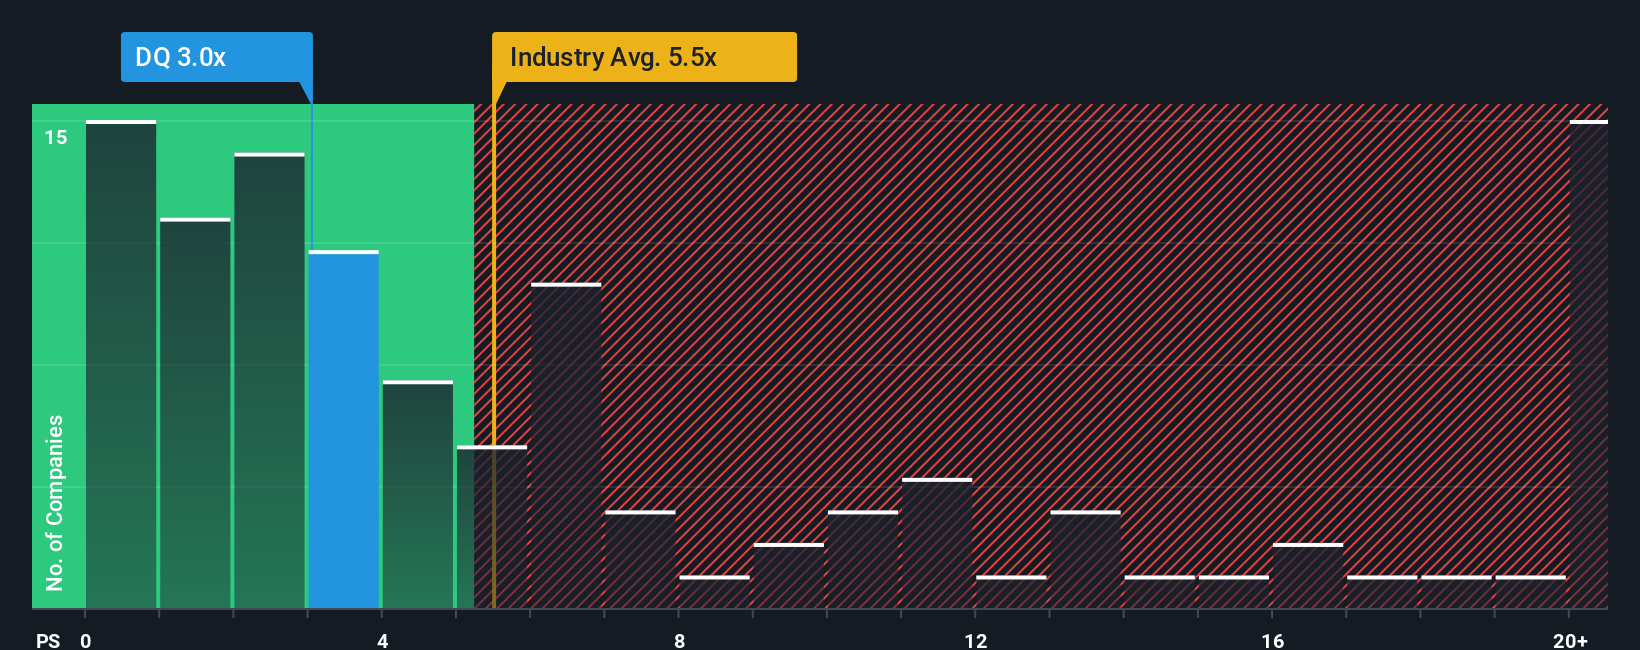
Daqo New Energy currently trades on a P/S of 2.45x. That sits below both the broader Semiconductor industry average P/S of 5.47x and the peer group average of 2.68x. On the surface, that suggests the market is attaching a lower value to Daqo’s sales than to those of many competitors.
Simply Wall St’s Fair Ratio framework goes a step further. It estimates what P/S might be reasonable for a specific company given its earnings growth profile, industry, profit margins, market cap and risk factors. Because it is tailored to the company, it can be more informative than a simple comparison with peers or industry averages, which may have very different fundamentals.
For Daqo, the Fair Ratio is 0.92x, below the current 2.45x P/S. On this measure, the shares screen as valued higher than the Fair Ratio suggests.
Result: OVERVALUED
P/S ratios tell one story, but what if the real opportunity lies elsewhere? Discover 1424 companies where insiders are betting big on explosive growth.
Upgrade Your Decision Making: Choose your Daqo New Energy Narrative
Earlier we mentioned that there is an even better way to understand valuation, so let us introduce you to Narratives, which are simply your story about a company linked directly to numbers like fair value, revenue, earnings and margins. On Simply Wall St’s Community page, used by millions of investors, you can set up a Narrative for Daqo New Energy that ties your view of its business to a financial forecast and then to a fair value estimate. You can then compare that fair value with the current share price to decide whether you see Daqo as an opportunity to buy, a holding to keep, or a position to reduce. Narratives update automatically when new information such as earnings reports or news is added, so your story is always connected to the latest data. For example, one Daqo New Energy Narrative might assume a very cautious revenue outlook and low fair value while another expects stronger revenue and profitability and therefore a much higher fair value, and both can sit side by side for you to compare.
Do you think there's more to the story for Daqo New Energy? Head over to our Community to see what others are saying!

This article by Simply Wall St is general in nature. We provide commentary based on historical data and analyst forecasts only using an unbiased methodology and our articles are not intended to be financial advice. It does not constitute a recommendation to buy or sell any stock, and does not take account of your objectives, or your financial situation. We aim to bring you long-term focused analysis driven by fundamental data. Note that our analysis may not factor in the latest price-sensitive company announcements or qualitative material. Simply Wall St has no position in any stocks mentioned.
Have feedback on this article? Concerned about the content? Get in touch with us directly. Alternatively, email editorial-team@simplywallst.com