
- LIVE QUOTES
- LEARN
- HELP
 Nasdaq
 Wall Street Journal
EN
Is Champion Homes (SKY) Starting To Look Interesting After Recent Share Price Weakness
- If you are wondering whether Champion Homes is starting to look like value after a weak share price patch, this article will walk through what the current price might be implying about the business.
- The stock last closed at US$76.03, with returns of an 11.8% decline over 7 days, a 10.5% decline over 30 days, a 10.5% decline year to date, but a 10.5% gain over 3 years and an 81.1% gain over 5 years. This mix of short term weakness and longer term gains can leave investors questioning whether recent weakness is a short term setback or part of a longer reset.
- Recent coverage has focused on how Champion Homes fits into the broader US housing and manufactured homes market. This has included commentary on demand trends and affordability pressures, as well as how factory built housing is positioned within that backdrop. This context helps explain why sentiment around the stock can shift quickly, as investors weigh near term housing data against longer term structural demand for manufactured homes.
- On our framework, Champion Homes has a valuation score of 1 out of 6, which suggests only one of the six valuation checks currently points to the shares looking undervalued. Next we will walk through the different valuation approaches behind that score before finishing with a more holistic way to think about what the market is really pricing in.
Champion Homes scores just 1/6 on our valuation checks. See what other red flags we found in the full valuation breakdown.
Approach 1: Champion Homes Discounted Cash Flow (DCF) Analysis
A Discounted Cash Flow, or DCF, model takes projected future cash flows and discounts them back to today using a required rate of return to estimate what the business may be worth right now.
For Champion Homes, the model uses a 2 Stage Free Cash Flow to Equity approach. The latest twelve-month free cash flow is about US$191.9 million. Analysts provide free cash flow estimates out to 2028, with Simply Wall St then extrapolating further to build a 10-year path. Within that path, projected free cash flow for 2028 is US$215.8 million, and the later years out to 2035 are based on smaller step ups each year.
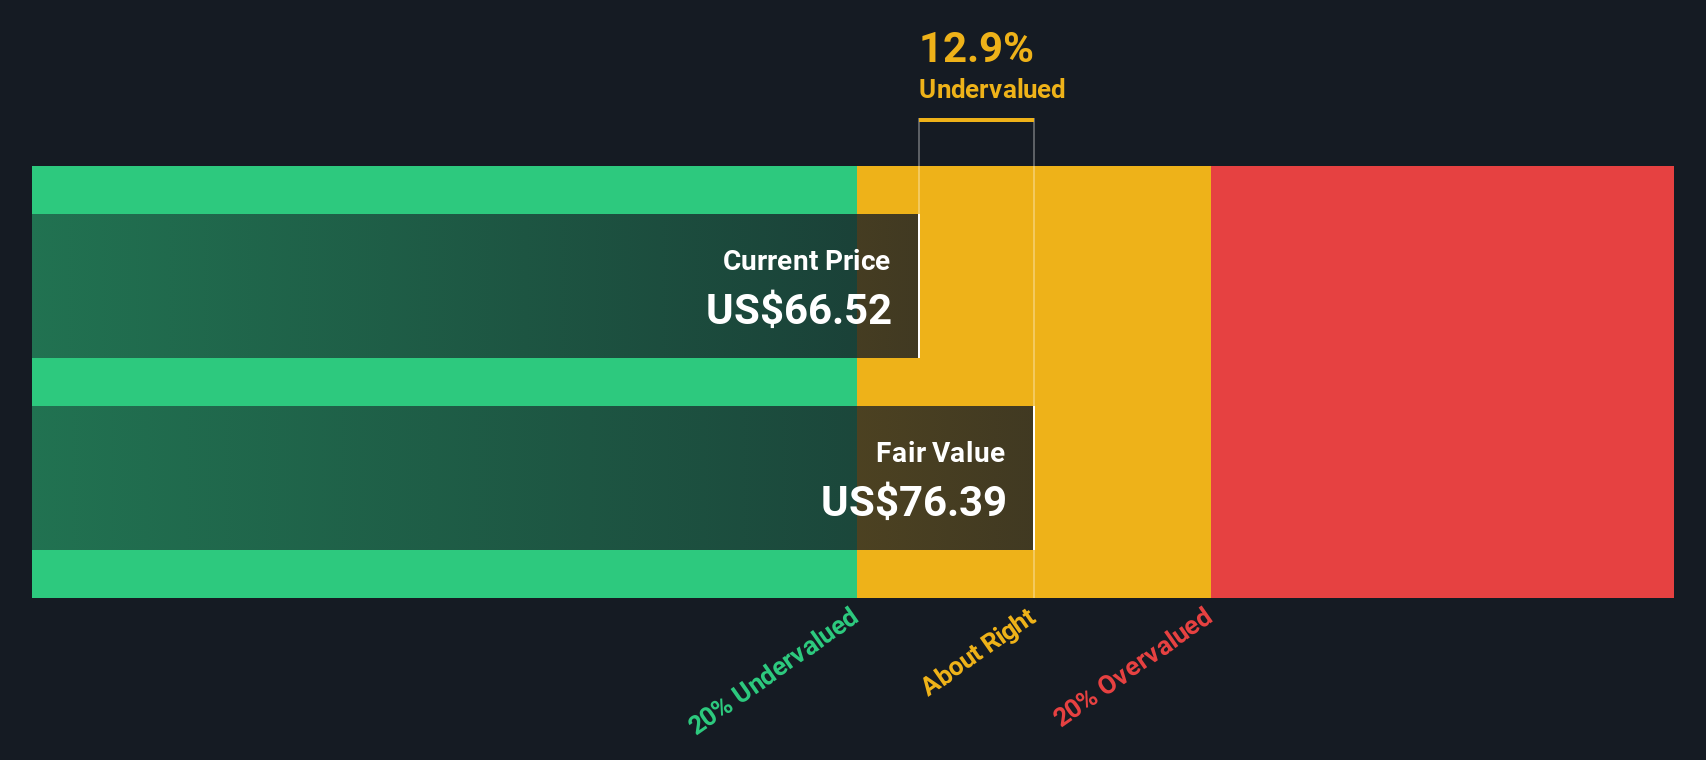
When all those projected cash flows are discounted back and a terminal value is added, the DCF model arrives at an estimated intrinsic value of US$70.16 per share. Compared with the recent share price of US$76.03, this implies the stock is about 8.4% overvalued on this model, which is a relatively modest gap.
Result: ABOUT RIGHT
Champion Homes is fairly valued according to our Discounted Cash Flow (DCF), but this can change at a moment's notice. Track the value in your watchlist or portfolio and be alerted on when to act.
Approach 2: Champion Homes Price vs Earnings (P/E)
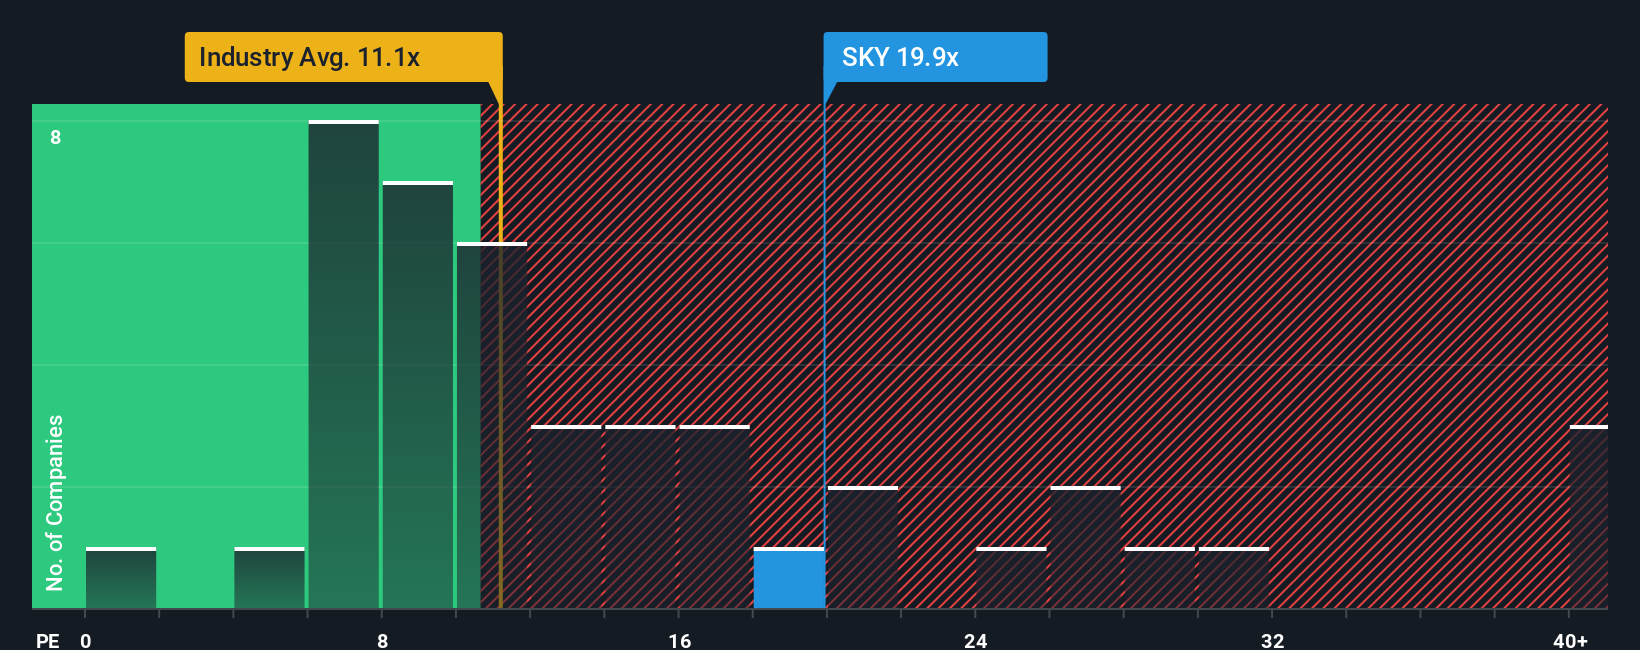
For profitable companies like Champion Homes, the P/E ratio is a useful way to consider what you are paying for each dollar of current earnings. It connects directly to the business reality that, as an owner, your claim on profits is what ultimately matters.
What counts as a "normal" or "fair" P/E depends on what the market expects for growth and how much risk it sees in those earnings. Higher expected growth or lower perceived risk can justify a higher P/E, while slower growth or higher risk usually points to a lower P/E.
Champion Homes currently trades on a P/E of 19.24x. That sits above the Consumer Durables industry average of 11.72x and also above the peer average of 11.84x. Simply Wall St's Fair Ratio for Champion Homes, which is 14.50x, estimates the P/E that might be reasonable after accounting for factors such as earnings growth profile, industry, profit margins, market cap and key risks.
This Fair Ratio is more tailored than a simple comparison with peers or the industry, because it adjusts for the company’s own characteristics rather than assuming all businesses in the group should trade on the same multiple. With a current P/E of 19.24x versus a Fair Ratio of 14.50x, the shares appear to be trading above that fair range.
Result: OVERVALUED
P/E ratios tell one story, but what if the real opportunity lies elsewhere? Discover 1422 companies where insiders are betting big on explosive growth.
Upgrade Your Decision Making: Choose your Champion Homes Narrative
Earlier we mentioned that there is an even better way to understand valuation, so let us introduce you to Narratives, which are simply your story about Champion Homes connected to your view of its future numbers.
A Narrative lets you spell out how you think revenue, earnings and margins might evolve, then links that story directly to a financial forecast and a fair value estimate rather than leaving those forecasts as abstract figures.
On Simply Wall St, within the Community page used by millions of investors, Narratives are an easy tool you can edit yourself, compare against others, and use to see how your fair value stacks up against the current share price. This can help you decide if Champion Homes looks expensive, cheap, or roughly in line with your expectations.
Because these Narratives update when new information such as earnings releases or major news is added to the platform, your fair value view adjusts with the story. One investor might see Champion Homes as attractive based on their chosen forecasts, while another, using more cautious assumptions, reaches a much lower fair value and a very different conclusion about what to do next.
Do you think there's more to the story for Champion Homes? Head over to our Community to see what others are saying!

This article by Simply Wall St is general in nature. We provide commentary based on historical data and analyst forecasts only using an unbiased methodology and our articles are not intended to be financial advice. It does not constitute a recommendation to buy or sell any stock, and does not take account of your objectives, or your financial situation. We aim to bring you long-term focused analysis driven by fundamental data. Note that our analysis may not factor in the latest price-sensitive company announcements or qualitative material. Simply Wall St has no position in any stocks mentioned.
Have feedback on this article? Concerned about the content? Get in touch with us directly. Alternatively, email editorial-team@simplywallst.com