
- LIVE QUOTES
- LEARN
- HELP
 Nasdaq
 Wall Street Journal
EN
Has Napco Security Technologies (NSSC) Run Too Far After Its 68% One-Year Share Price Jump?
- Investors may be wondering whether Napco Security Technologies, at around US$43.74, is still a sensible entry or addition to a portfolio, or if most of the value story is already reflected in the price.
- The stock has moved sharply at times, with returns of 13.7% over the last 7 days, 5.7% over the last 30 days, 5.7% year to date, 68.3% over the last year, 27.3% over 3 years, and 198.1% over 5 years. This naturally raises questions about risk and reward at today's level.
- Recent attention on Napco Security Technologies has centered on its role in electronic security solutions, as investors look for companies tied to safety and access control themes. This has kept the stock on many watchlists as the market weighs how much of that story is already reflected in the current valuation.
- Even so, Napco Security Technologies only scores 1 out of 6 on our valuation checks. We will look at how different valuation approaches frame that result, and then finish with a way of thinking about value that goes beyond a single score.
Napco Security Technologies scores just 1/6 on our valuation checks. See what other red flags we found in the full valuation breakdown.
Approach 1: Napco Security Technologies Discounted Cash Flow (DCF) Analysis
A Discounted Cash Flow model takes projected future cash flows and then discounts them back to today to estimate what the entire business might be worth per share right now. It is essentially asking what those future dollars are worth in today's terms.
For Napco Security Technologies, the model uses a 2 Stage Free Cash Flow to Equity approach, starting from last twelve months free cash flow of about $52.45 million. Analysts provide explicit free cash flow estimates up to 2027, with $47.20 million in 2026 and $49.95 million in 2027. Beyond that, Simply Wall St extrapolates cash flows out to 2035, reaching a projected $59.14 million in 2035 based on modest incremental changes each year.
When all those projected cash flows are discounted back and summed, the model arrives at an estimated intrinsic value of about $24.61 per share. With the shares trading around $43.74, the DCF output implies the stock is roughly 77.7% above this estimate. On this model, Napco Security Technologies screens as expensive rather than cheap at current levels.
Result: OVERVALUED
Our Discounted Cash Flow (DCF) analysis suggests Napco Security Technologies may be overvalued by 77.7%. Discover 873 undervalued stocks or create your own screener to find better value opportunities.

Approach 2: Napco Security Technologies Price vs Earnings
For profitable companies, the P/E ratio is a straightforward way to link what you pay for each share to the underlying earnings. It lets you quickly see how many dollars of share price are being attributed to each dollar of current earnings.
What counts as a normal or fair P/E usually reflects two big things: growth expectations and risk. Higher expected earnings growth or lower perceived risk tend to support higher P/E levels, while slower growth or higher risk usually point to lower P/E levels.
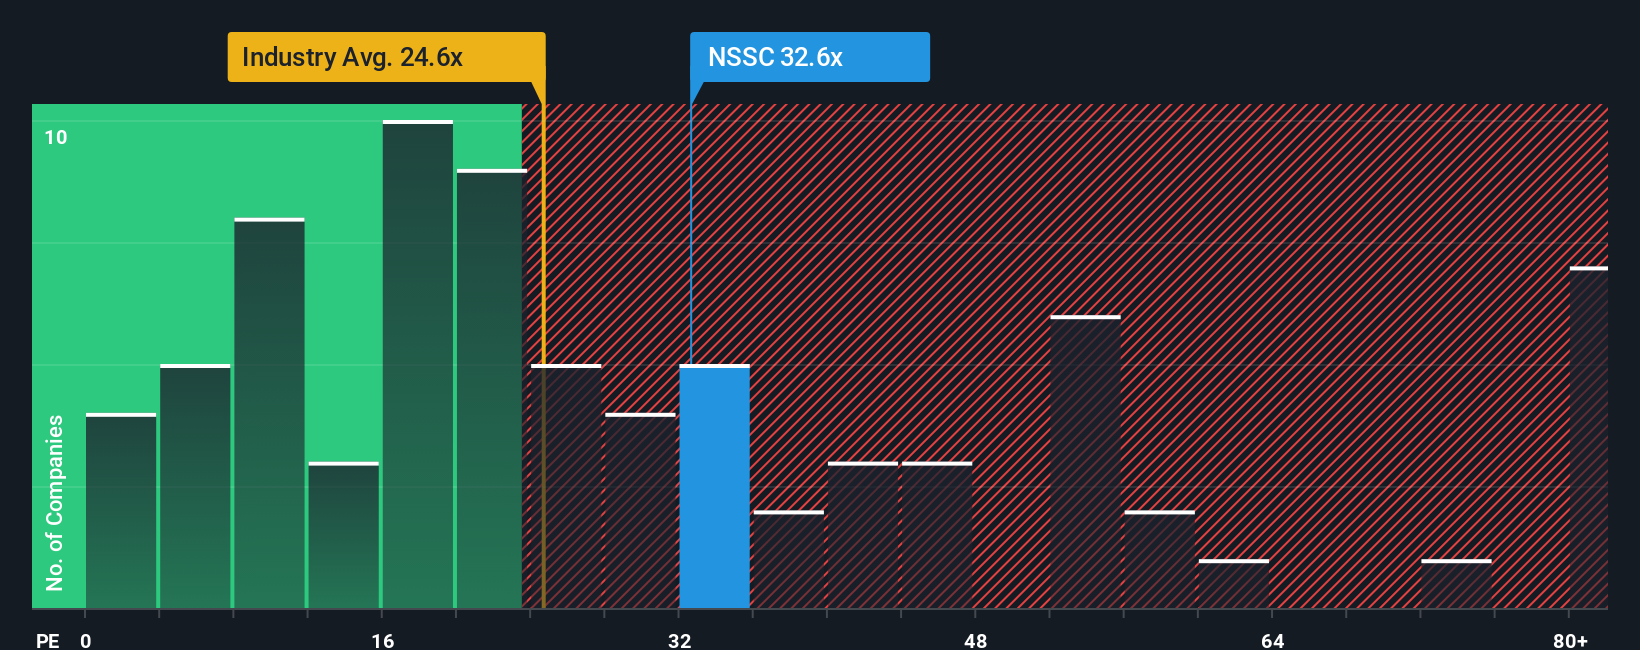
Napco Security Technologies currently trades on a P/E of 32.90x. That is above the Electronic industry average P/E of about 27.18x, and below the peer average of 90.15x. Simply Wall St also calculates a proprietary Fair Ratio of 22.07x for Napco Security Technologies, which is the P/E it might trade on given factors such as its earnings growth profile, industry, profit margins, market cap and specific risks.
The Fair Ratio adds more context than a simple comparison with peers or the industry because it folds these company specific drivers into a single benchmark. With the current 32.90x P/E sitting well above the 22.07x Fair Ratio, the shares look expensive on this metric.
Result: OVERVALUED
P/E ratios tell one story, but what if the real opportunity lies elsewhere? Discover 1426 companies where insiders are betting big on explosive growth.
Upgrade Your Decision Making: Choose your Napco Security Technologies Narrative
Earlier we mentioned that there is an even better way to understand valuation, so let us introduce you to Narratives, a simple way to connect the story you believe about Napco Security Technologies with the numbers you think are fair for its future revenue, earnings and margins.
On Simply Wall St, Narratives let you set your own assumptions, turn them into a forward looking forecast and then into a fair value per share. You can do all of this in one place within the Community page that is used by millions of investors.
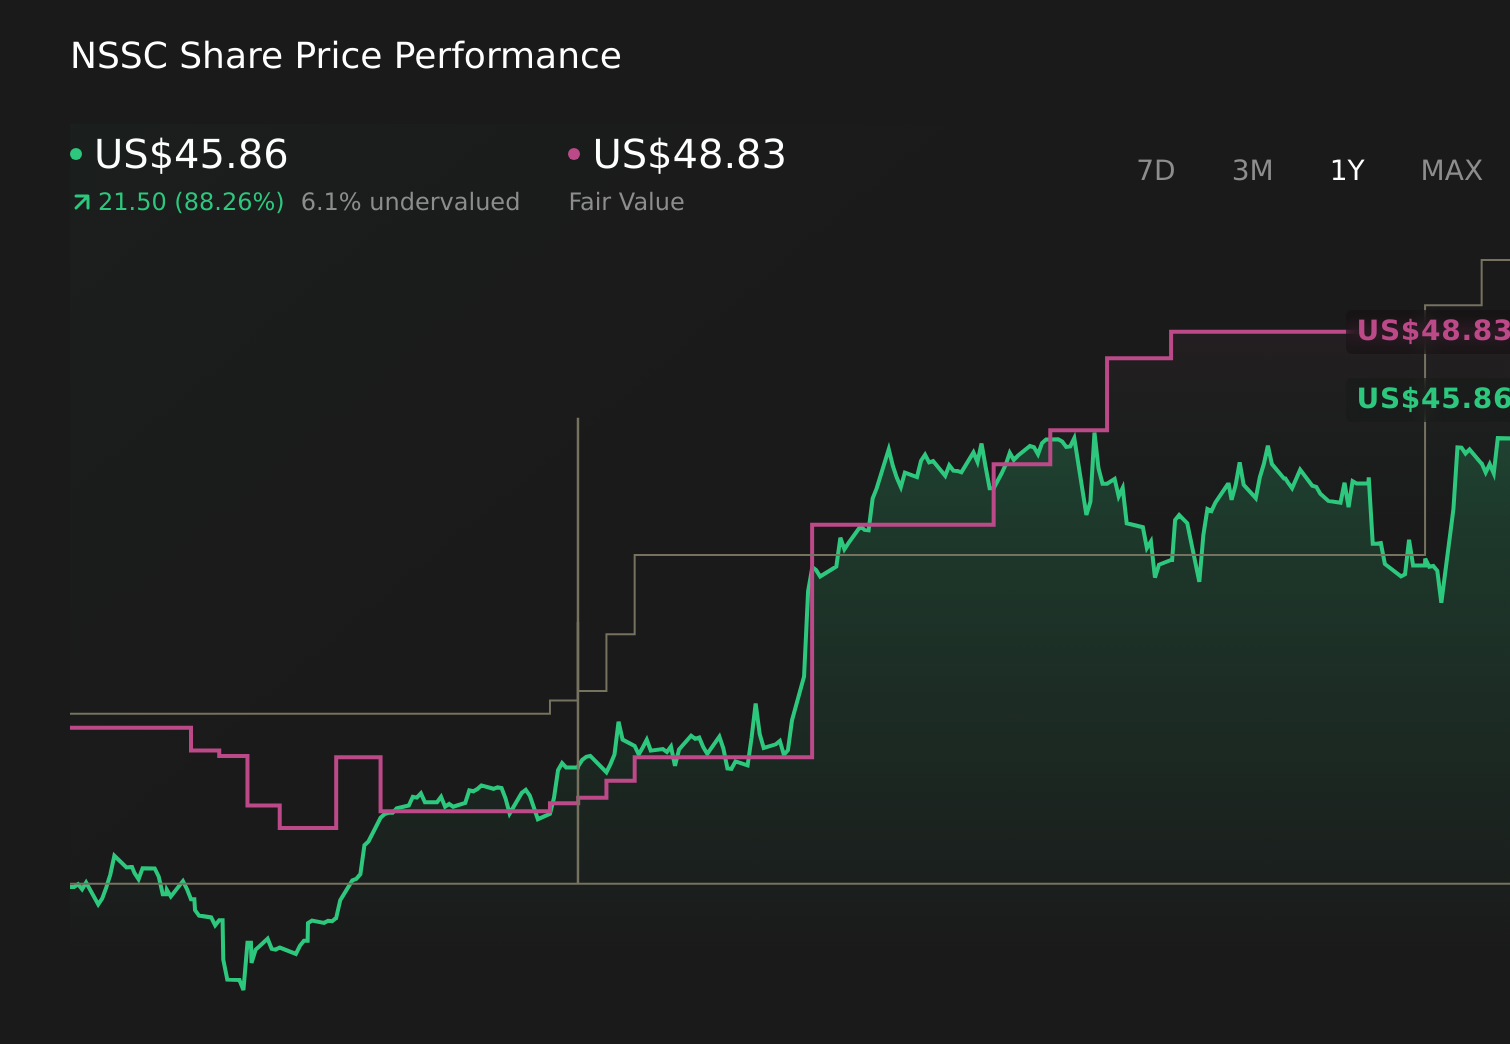
Once you have a Narrative, you can compare your fair value with the current market price and use that gap to help decide whether Napco Security Technologies looks attractive, fully priced or stretched to you. The tool automatically refreshes when new news, earnings or other data are added.
For example, one Napco Security Technologies Narrative might point to a very cautious fair value, while another assumes a much higher fair value. This shows how different investors can look at the same company and reach very different conclusions about what the shares are worth today.
Do you think there's more to the story for Napco Security Technologies? Head over to our Community to see what others are saying!
This article by Simply Wall St is general in nature. We provide commentary based on historical data and analyst forecasts only using an unbiased methodology and our articles are not intended to be financial advice. It does not constitute a recommendation to buy or sell any stock, and does not take account of your objectives, or your financial situation. We aim to bring you long-term focused analysis driven by fundamental data. Note that our analysis may not factor in the latest price-sensitive company announcements or qualitative material. Simply Wall St has no position in any stocks mentioned.
Have feedback on this article? Concerned about the content? Get in touch with us directly. Alternatively, email editorial-team@simplywallst.com