
- LIVE QUOTES
- LEARN
- HELP


EN
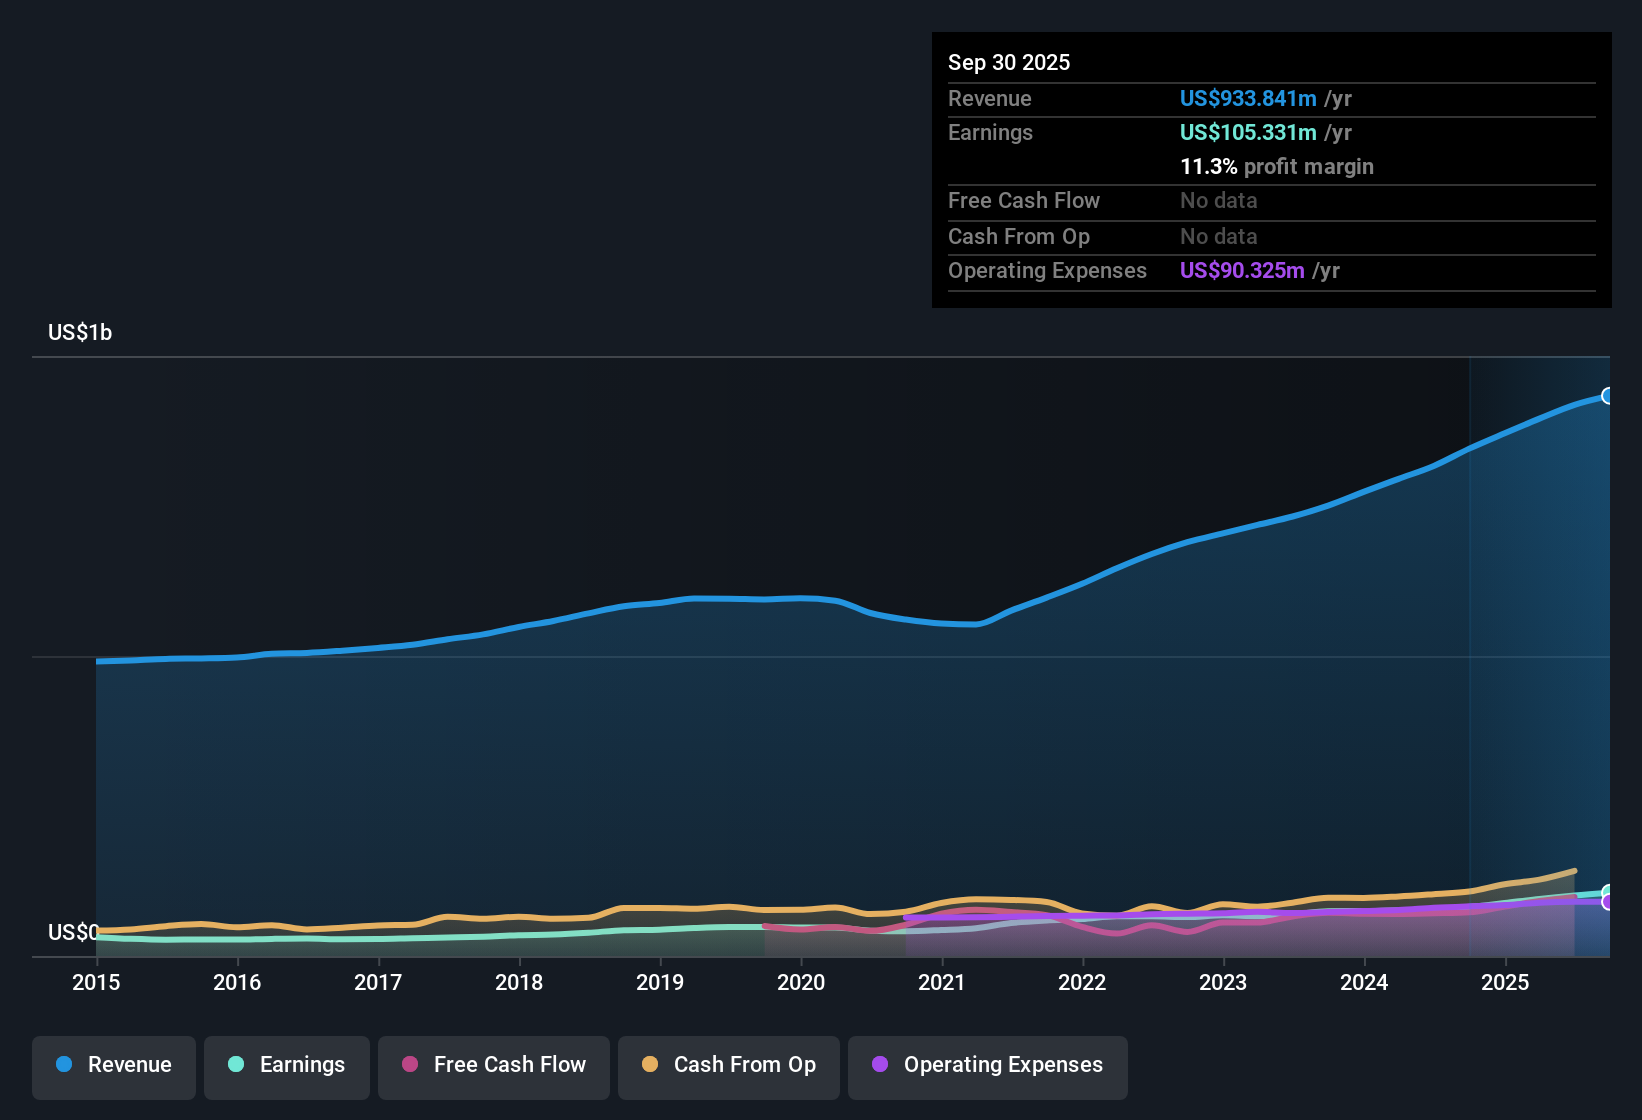
CorVel (CRVL) Earnings Growth And 11.3% Margin Challenge Cautious Narratives
CorVel (CRVL) has just wrapped up Q3 2026 with its recent numbers anchored by the latest reported quarter, where revenue in Q2 2026 was US$239.6 million and basic EPS came in at US$0.54. This feeds into trailing 12 month EPS of US$2.05 and net income of US$105.3 million. Over the recent reporting periods, the company has seen revenue move from US$224.4 million in Q2 2025 to US$239.6 million in Q2 2026, with basic EPS stepping from US$0.46 to US$0.54 over the same quarters. This sets up a story backed by trailing 12 month earnings growth of 29.2% and a net profit margin of 11.3% compared with 9.6% a year earlier, which gives this update a clear profitability and margin focus for investors.
See our full analysis for CorVel.With the headline figures on the table, the next step is to see how these margins and earnings trends line up against the most widely held narratives around CorVel and where those narratives might be pushed to adjust.
Curious how numbers become stories that shape markets? Explore Community Narratives
29.2% Earnings Growth Puts Recent Quarters in Context
- Over the trailing 12 months, CorVel earned US$105.3 million in net income on US$933.8 million of revenue, with basic EPS at US$2.05, which sits above the quarterly figures of US$0.54 in Q2 2026 and US$0.46 in Q2 2025.
- Supporters of a more optimistic view often point to this 29.2% trailing earnings growth. The quarterly path, however, shows a more gradual move, with net income in the last six reported quarters ranging from US$21.6 million to US$27.9 million, which invites questions about how much of the bullish case is based on the full 12 month picture versus the step by step quarterly trend.
- For example, net income was US$21.6 million in Q1 2025 and US$27.9 million in Q2 2026, so the higher trailing figure reflects several periods added together rather than a single breakout quarter.
- EPS moved from US$0.42 in Q1 2025 to US$0.54 in Q2 2026, which lines up with the longer term growth rate of 14.8% a year over five years and gives some context to the 29.2% trailing jump.
Margins Hold At 11.3% On TTM Basis
- The trailing 12 month net profit margin sits at 11.3% on US$933.8 million of revenue and US$105.3 million of net income, compared with 9.6% over the prior 12 month period cited in the data.
- What stands out for a bullish angle is that this margin level lines up with steadily higher quarterly net income, from US$23.4 million in Q2 2025 to US$27.9 million in Q2 2026. This suggests that the 11.3% figure reflects a series of periods where revenue has been between roughly US$211.7 million and US$239.6 million rather than a single spike.
- Revenue over the last six quarters ranged from US$211.7 million to US$239.6 million, while net income ranged from US$21.6 million to US$27.9 million, which is consistent with the higher trailing margin compared with the earlier 9.6% reference.
- This pattern means the improved trailing margin is being calculated across several quarters where both revenue and earnings sit in a relatively tight band, which supports a view that the higher margin is tied to ongoing operations rather than one time items.
P/E of 25.1x and 14% Gap to DCF Fair Value
- CorVel trades on a P/E of 25.1x compared with a US Healthcare industry average of 22.6x and a peer group average of 55.6x, while the current share price of US$51.58 sits about 14% below a DCF fair value estimate of roughly US$60.00.
- General market opinion that the stock is not overly stretched is heavily shaped by this mix of metrics, since the P/E is above the broad industry but below peers. The gap between the share price and the DCF fair value sits alongside trailing EPS of US$2.05 and 11.3% margins, which together present investors with a set of numbers that can support either a valuation premium or a focus on the discount to the DCF line.
- Investors looking at the P/E in the context of 29.2% trailing earnings growth may see the 25.1x multiple as driven in part by that growth record, even though it still sits under the cited 55.6x peer average.
- At the same time, the 14% gap between the US$51.58 share price and the US$60.00 DCF fair value sits alongside the improved margin from 9.6% to 11.3%, which some readers may view as useful background when
Next Steps
Don't just look at this quarter; the real story is in the long-term trend. We've done an in-depth analysis on CorVel's growth and its valuation to see if today's price is a bargain. Add the company to your watchlist or portfolio now so you don't miss the next big move.
See What Else Is Out There
CorVel’s earnings story leans heavily on trailing 12 month figures, while quarterly EPS and net income move in a relatively narrow band that may not fully support more optimistic expectations.
If you want ideas with a clearer pattern of consistent revenue and earnings progress, check out our stable growth stocks screener (2197 results) and quickly compare companies that have built steadier momentum over time.
This article by Simply Wall St is general in nature. We provide commentary based on historical data and analyst forecasts only using an unbiased methodology and our articles are not intended to be financial advice. It does not constitute a recommendation to buy or sell any stock, and does not take account of your objectives, or your financial situation. We aim to bring you long-term focused analysis driven by fundamental data. Note that our analysis may not factor in the latest price-sensitive company announcements or qualitative material. Simply Wall St has no position in any stocks mentioned.
Have feedback on this article? Concerned about the content? Get in touch with us directly. Alternatively, email editorial-team@simplywallst.com